Sources
Every value in the calculator, where it was read or how it was calculated, and the people whose work it rests on.
Attribution
The teaspoon-of-sugar method and nearly every food value on this site are the work of Dr David Unwin, a general practitioner at Norwood Surgery in Southport, England, and his co-authors Dr David Haslam and Dr Geoffrey Livesey. The paper credits Dr Livesey with the calculations that produce the teaspoon equivalents.
The method is published as: Unwin D, Haslam D, Livesey G. It is the glycaemic response to, not the carbohydrate content of food that matters in diabetes and obesity: The glycaemic index revisited. Journal of Insulin Resistance. 2016;1(1):a8. DOI: 10.4102/jir.v1i1.8. The journal now publishes as the Journal of Metabolic Health, and the article is available at journalofmetabolichealth.org.
The sugar infographics are distributed free by the Public Health Collaboration, a UK registered charity, at phcuk.org/sugar, where they are also available in more than 40 translations.
Licence and permission to reuse
This site reproduces numerical values from the infographics and the paper. It does not reproduce the infographic images. Three different kinds of permission bear on that material, and they are not the same thing. Each is set out separately below, as checked when this page was built.
What is formally licensed
The Journal of Insulin Resistance (Journal of Metabolic Health) states that all its articles are published under the Creative Commons Attribution 4.0 International licence (CC BY 4.0) unless otherwise stated. The licence field on this article's own page reads "Other", so this site could not confirm that the 2016 paper itself carries CC BY 4.0. The article is © 2016 David Unwin, David Haslam and Geoffrey Livesey. As a precaution, the values are attributed here in the form CC BY 4.0 requires: the work, its authors and its source are named above, and the changes made are listed below.
What the author has stated publicly
On 26 May 2021, Dr Unwin posted a seven-part thread on X from his account @lowcarbGP introducing the sugar infographics. The first post links to phcuk.org/sugar and describes the charts as "Freely available". The second post reads, in part:
"The 7 sugar infographics are now available in 14 languages and no copyright, so please use freely."
This is a public statement by the author on social media. It is not a formal licence: it names no licence terms, it refers to the seven charts published at that date, and it is not a statement by the Public Health Collaboration, which distributes the charts, or by the journal. This site records it for completeness and does not rely on it for any claim made elsewhere on the site.
What is neither
The Public Health Collaboration's sugar page offers the infographics as free downloads. No licence statement was found on that page; its footer reads © Public Health Collaboration. Any chart added to the set after May 2021 is not covered by the statement above, and no licence for it was found.
Changes made: values are shown to one decimal place; portion descriptions have been expanded with US-recognisable measures alongside the published gram weights; foods from several charts have been combined into one list and sorted into categories; where charts disagree, one value is used and the other is recorded below.
This site is independent. It is not affiliated with, reviewed by or endorsed by Dr Unwin, his co-authors, the Public Health Collaboration or the journal.
How each value was produced
Every food carries one of three derivation labels:
- Read from infographic (59 foods): the teaspoon figure is printed on one of Dr Unwin's charts and was copied as printed.
- Published GL table (7 foods): the teaspoon figure is printed in Table 1 of the 2016 paper, which also gives GI, carbohydrate and glycaemic load.
- Calculated from GI and carb content (3 foods): chicken, salmon and beef. USDA FoodData Central lists 0.0g carbohydrate per 100g for each, so the glycaemic load is 0 whatever GI is assumed.
Where a chart prints a teaspoon figure but no glycaemic load, the GL column below was back-calculated as teaspoons × 2.73, the glycaemic load of one teaspoon of table sugar given in the paper. Those rows say so in their notes. The teaspoon figure is always the published one.
Sources last verified: 2026-09-13.
All 69 foods
The table scrolls sideways on narrow screens.
| Food | Category | Portion | Teaspoons | GL | Source | Derivation | Notes |
|---|---|---|---|---|---|---|---|
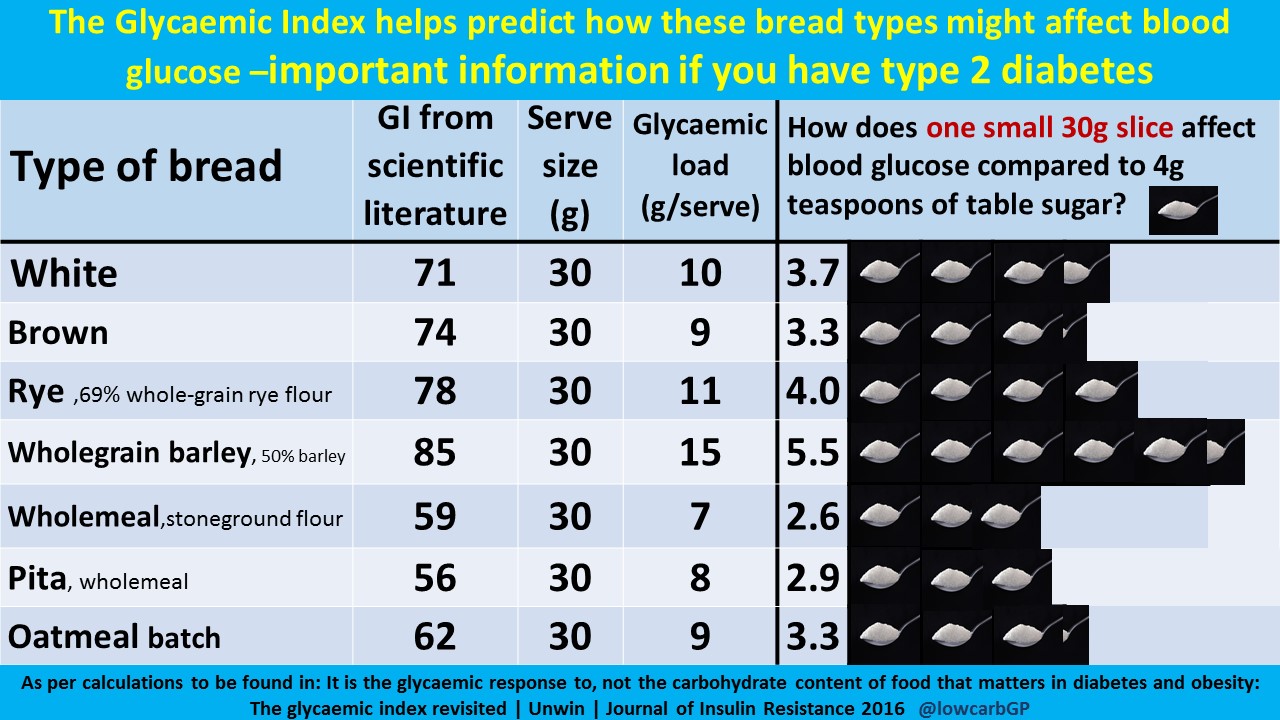
| White bread | Breads | 1 small slice (30g) | 3.7 | 10 | Bread (sugar infographic) | read from infographic | GI 71 as printed. |
| Brown bread | Breads | 1 small slice (30g) | 3.3 | 9 | Bread (sugar infographic) | read from infographic | GI 74 as printed. The common foods poster shows a 30g wholemeal slice at GI 74 as 3.0; the bread poster value is used here. Unwin 2016 Box 2 works this example as 9 / 2.73 = 3.3. |
| Rye bread (69% whole-grain rye flour) | Breads | 1 small slice (30g) | 4.0 | 11 | Bread (sugar infographic) | read from infographic | GI 78 as printed. |
| Wholegrain barley bread (50% barley) | Breads | 1 small slice (30g) | 5.5 | 15 | Bread (sugar infographic) | read from infographic | GI 85 as printed. |
| Wholemeal bread, stoneground flour | Breads | 1 small slice (30g) | 2.6 | 7 | Bread (sugar infographic) | read from infographic | GI 59 as printed. |
| Wholemeal pita | Breads | 30g portion (about half a small pita) | 2.9 | 8 | Bread (sugar infographic) | read from infographic | GI 56 as printed. |
| Oatmeal bread | Breads | 1 small slice (30g) | 3.3 | 9 | Bread (sugar infographic) | read from infographic | GI 62 as printed. Listed on the poster as 'Oatmeal batch'. |
| Roti (wheat flour) | Breads | 1 roti (40g) | 5.7 | 15.6 | South Asian foods (sugar infographic) | read from infographic | GI 57 as printed. GL not printed on the source; back-calculated as 5.7 x 2.73 = 15.6. |
| Roti (almond flour) | Breads | 1 roti (50g) | 0.2 | 0.5 | South Asian foods (sugar infographic) | read from infographic | GI 15 as printed. GL not printed on the source; back-calculated as 0.2 x 2.73 = 0.5. |
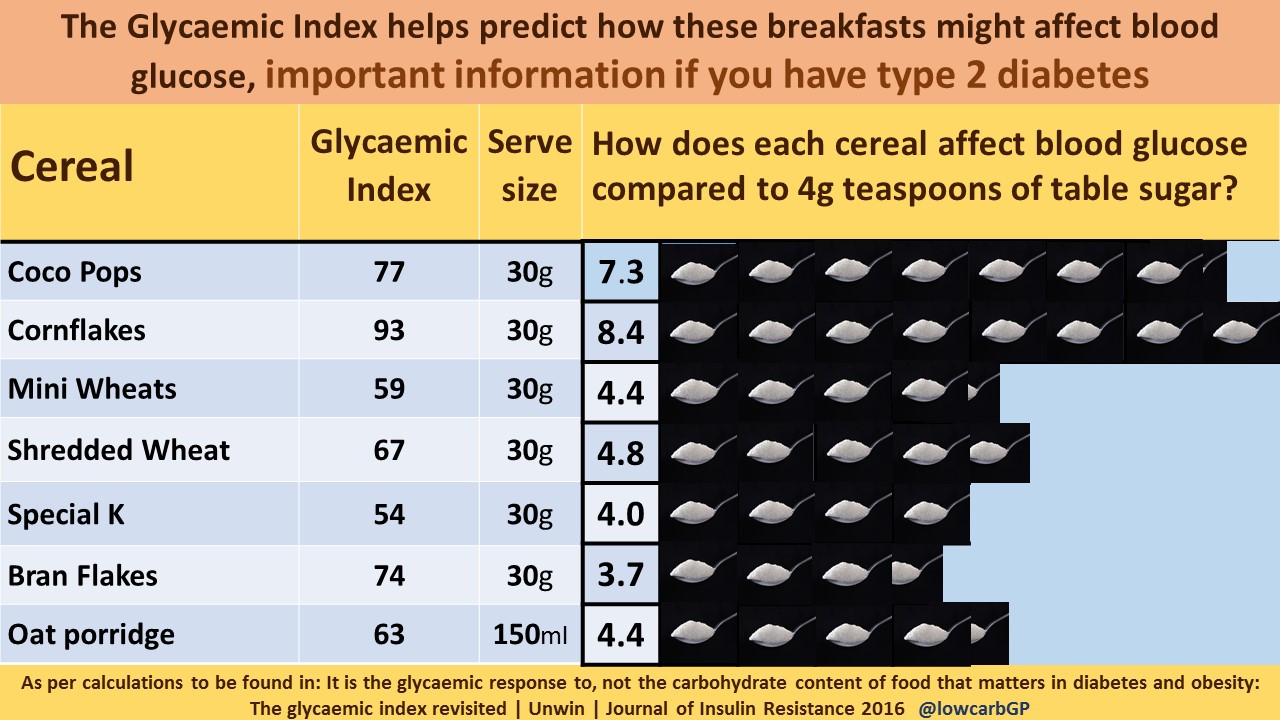
| Coco Pops (chocolate puffed rice) | Breakfast cereals | 1 bowl, dry (30g) | 7.3 | 19.9 | Breakfast cereals (sugar infographic) | read from infographic | GI 77 as printed. GL not printed on the source; back-calculated as 7.3 x 2.73 = 19.9. UK product. The sugar burden poster gives chocolate rice crispies as 24.4 per 100g, which is 7.3 per 30g, consistent with this value. |
| Cornflakes | Breakfast cereals | 1 bowl, dry (30g) | 8.4 | 22.9 | Breakfast cereals (sugar infographic) | read from infographic | GI 93 as printed. GL not printed on the source; back-calculated as 8.4 x 2.73 = 22.9. Unwin 2016 Table 1 prints 8.5 (GL 23) for the same portion; the poster value is used. |
| Mini Wheats | Breakfast cereals | 1 bowl, dry (30g) | 4.4 | 12 | Breakfast cereals (sugar infographic) | read from infographic | GI 59 as printed. GL not printed on the source; back-calculated as 4.4 x 2.73 = 12.0. UK product; poster does not state whether frosted. |
| Shredded wheat | Breakfast cereals | 1 bowl, dry (30g) | 4.8 | 13.1 | Breakfast cereals (sugar infographic) | read from infographic | GI 67 as printed. GL not printed on the source; back-calculated as 4.8 x 2.73 = 13.1. |
| Special K | Breakfast cereals | 1 bowl, dry (30g) | 4.0 | 10.9 | Breakfast cereals (sugar infographic) | read from infographic | GI 54 as printed. GL not printed on the source; back-calculated as 4.0 x 2.73 = 10.9. UK formulation; US Special K may differ. |
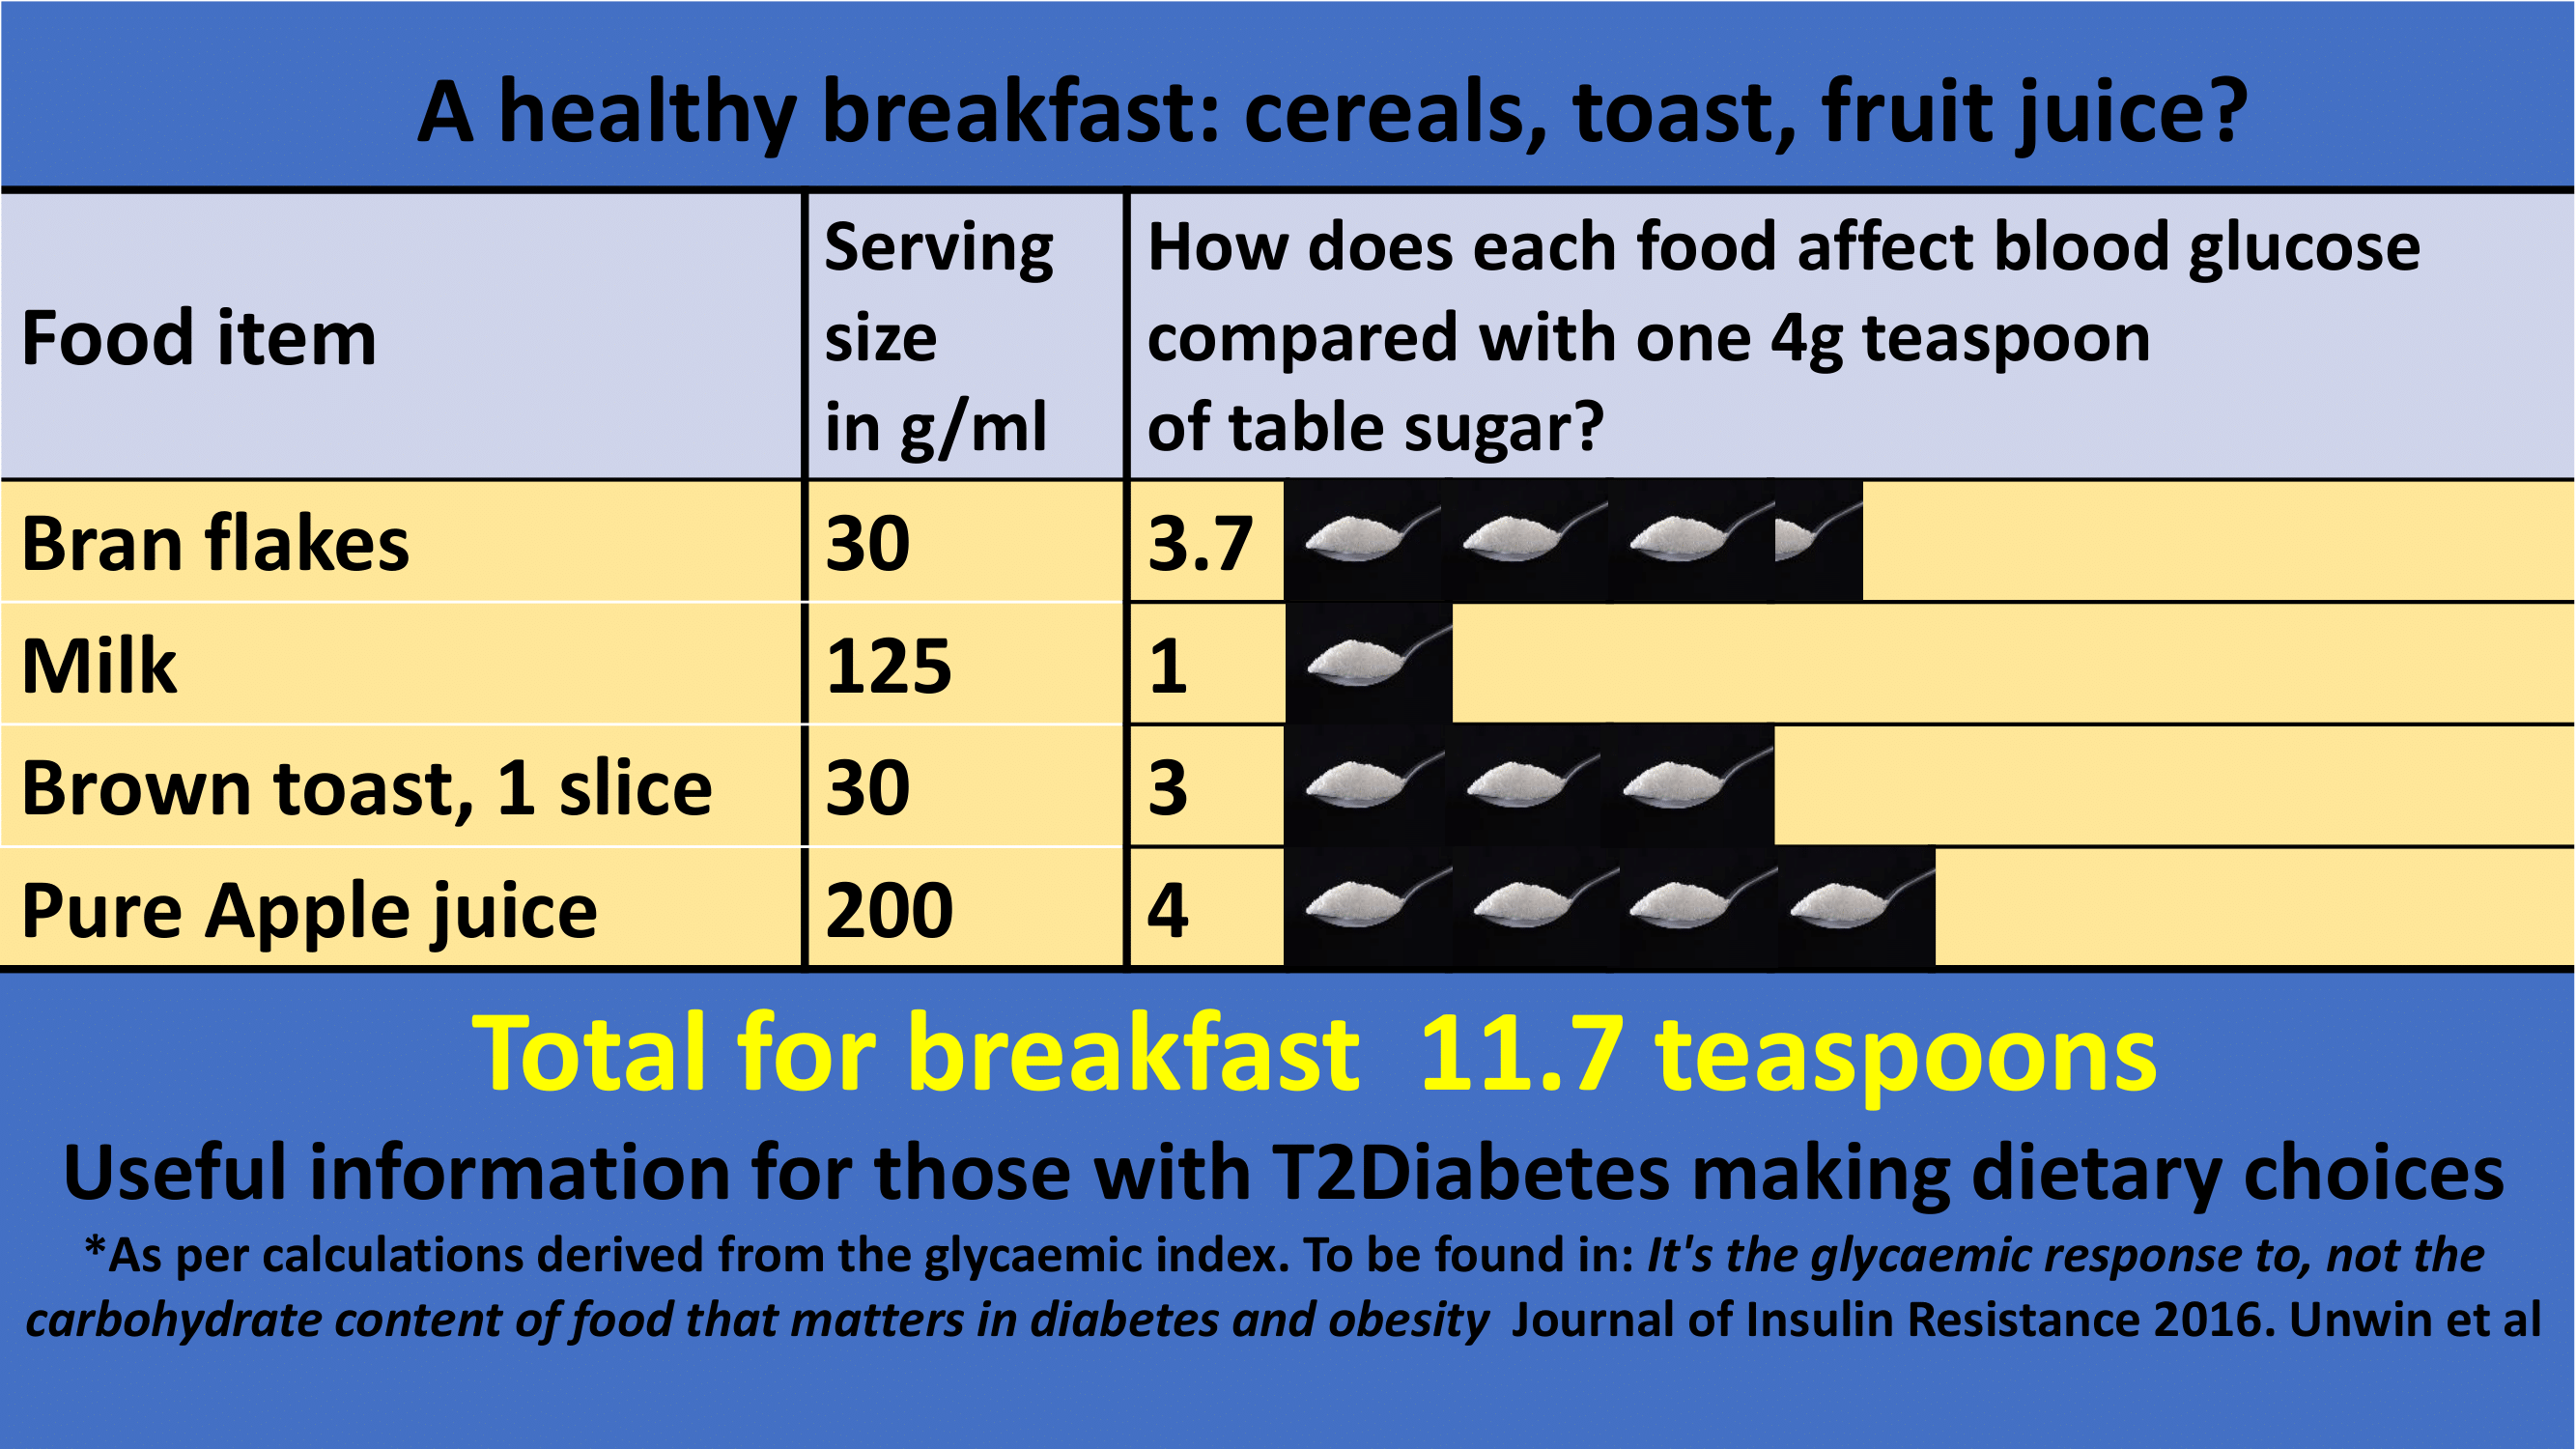
| Bran flakes | Breakfast cereals | 1 bowl, dry (30g) | 3.7 | 10.1 | Breakfast cereals (sugar infographic) | read from infographic | GI 74 as printed. GL not printed on the source; back-calculated as 3.7 x 2.73 = 10.1. Unwin 2016 Table 1 gives the same 3.7 for 30g but lists GI 50 and GL 10. The a healthy breakfast poster also gives 3.7. |
| Oat porridge | Breakfast cereals | 1 serving, cooked (150ml) | 4.4 | 12 | Breakfast cereals (sugar infographic) | read from infographic | GI 63 as printed. GL not printed on the source; back-calculated as 4.4 x 2.73 = 12.0. Portion is by volume on the poster. |
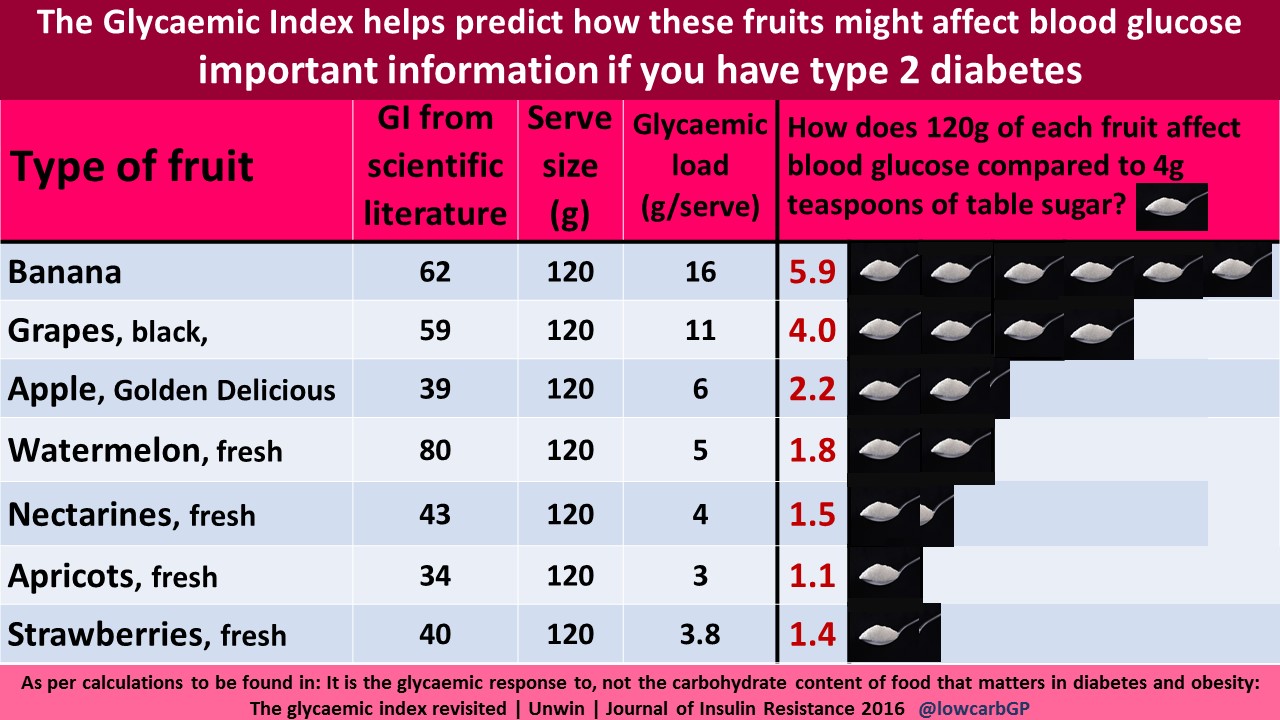
| Banana | Fruits | 1 medium, peeled (120g) | 5.9 | 16 | Fruits (sugar infographic) | read from infographic | GI 62 as printed. The common foods and fruits vs vegetables posters show 5.7 for the same 120g portion; the fruit poster value is used. |
| Black grapes | Fruits | about 20 grapes (120g) | 4.0 | 11 | Fruits (sugar infographic) | read from infographic | GI 59 as printed. |
| Apple (Golden Delicious) | Fruits | 1 small apple (120g) | 2.2 | 6 | Fruits (sugar infographic) | read from infographic | GI 39 as printed. The common foods poster and Unwin 2016 Table 1 give 2.3 for the same portion. |
| Watermelon | Fruits | about 3/4 cup diced (120g) | 1.8 | 5 | Fruits (sugar infographic) | read from infographic | GI 80 as printed. |
| Nectarine | Fruits | 1 medium (120g) | 1.5 | 4 | Fruits (sugar infographic) | read from infographic | GI 43 as printed. |
| Apricots, fresh | Fruits | about 3 apricots (120g) | 1.1 | 3 | Fruits (sugar infographic) | read from infographic | GI 34 as printed. |
| Strawberries | Fruits | about 8 strawberries (120g) | 1.4 | 3.8 | Fruits (sugar infographic) | read from infographic | GI 40 as printed. |
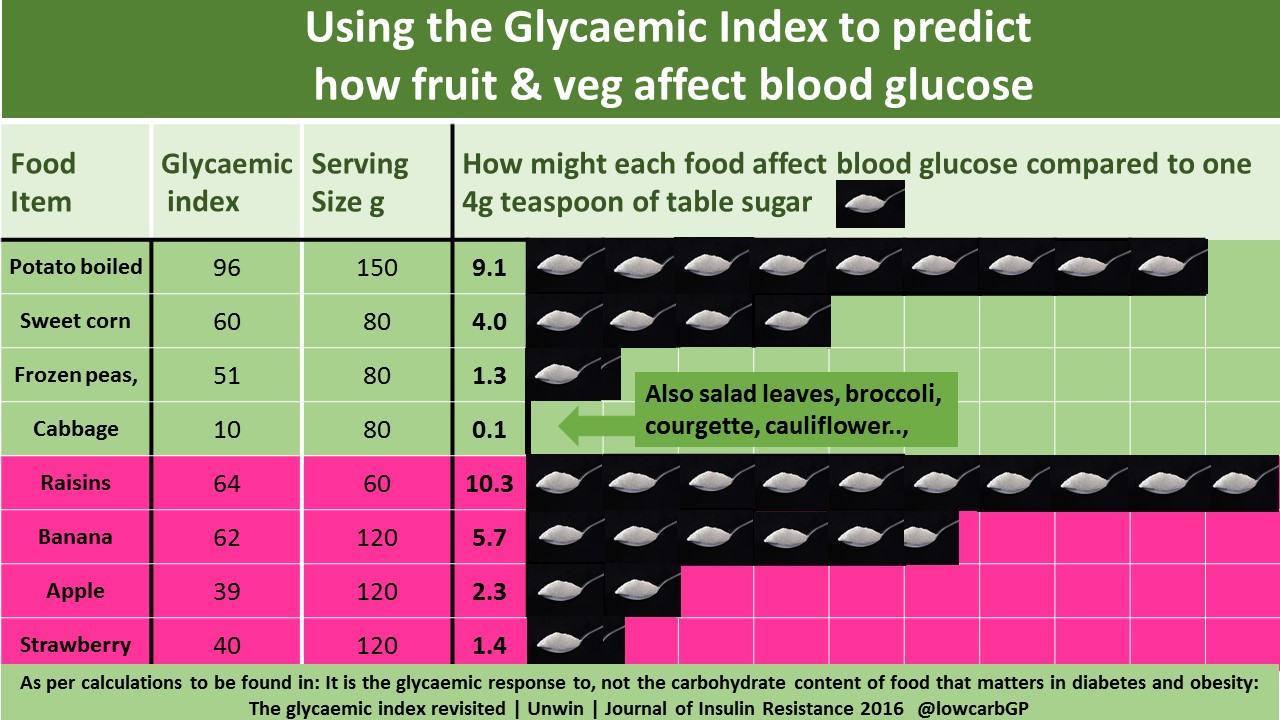
| Raisins | Fruits | about 1/3 cup (60g) | 10.3 | 28.1 | Fruits vs vegetables (sugar infographic) | read from infographic | GI 64 as printed. GL not printed on the source; back-calculated as 10.3 x 2.73 = 28.1. |
| Dried mixed fruit | Fruits | about 1/3 cup (60g) | 9.0 | 24 | It is the glycaemic response to, not the carbohydrate content of food that matters in diabetes and obesity: The glycaemic index revisited — Table 1 | published GL table | GI 60 as printed. Table 1 lists 41g available carbohydrate per serving. |
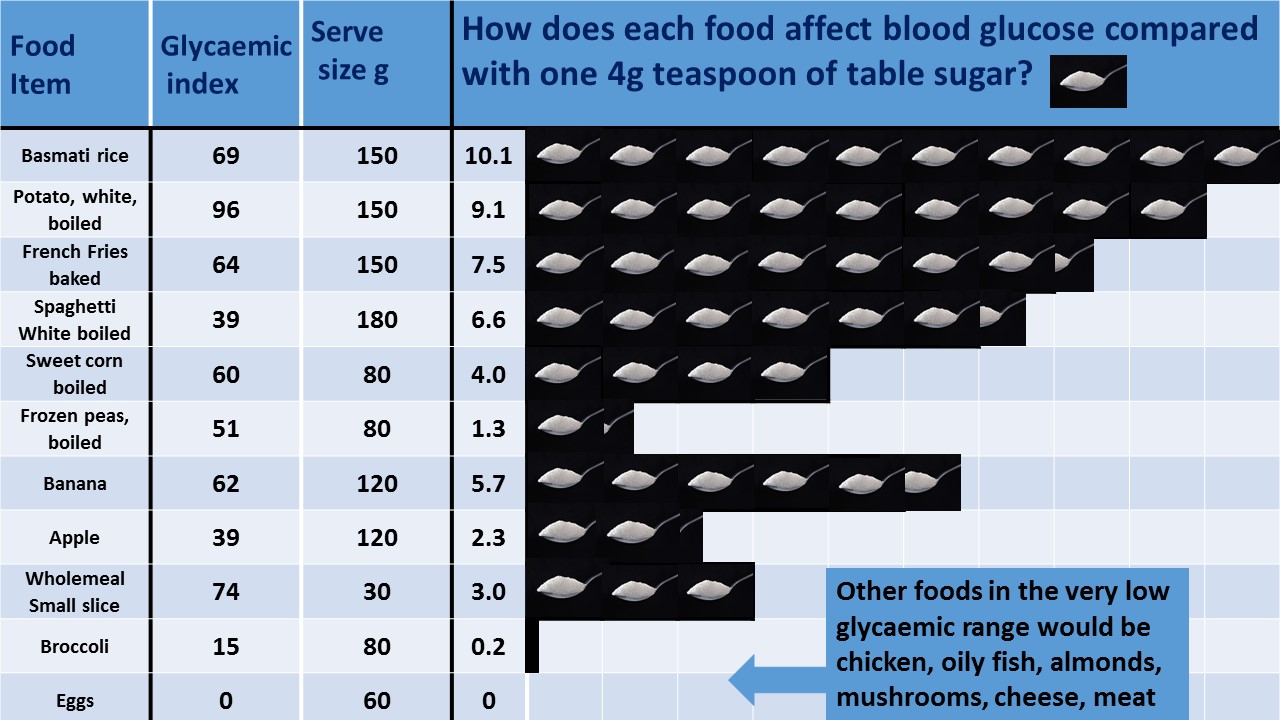
| Basmati rice, boiled | Staples | 1 bowl, cooked (150g) | 10.1 | 28 | Common foods (sugar infographic) | read from infographic | GI 69 as printed. GL 28 and 40g available carbohydrate from Unwin 2016 Table 1. The South Asian poster also gives 10.1 for 150g boiled rice. |
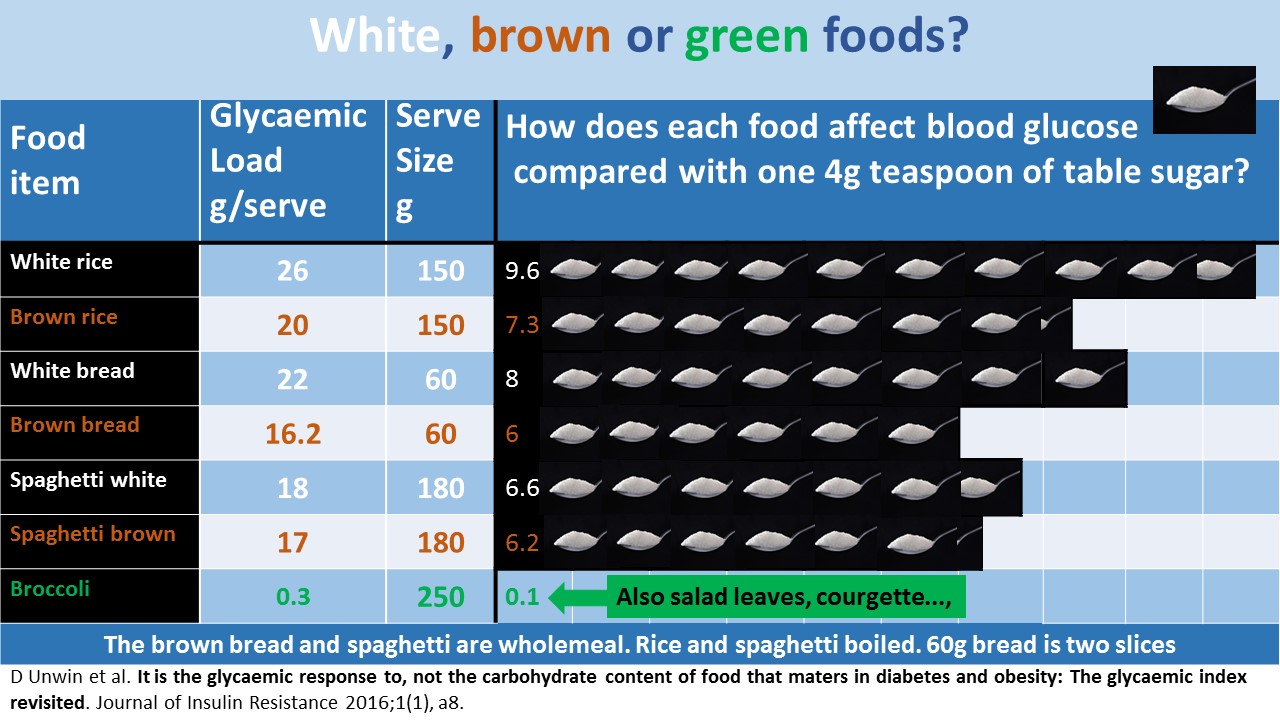
| White rice, boiled | Staples | 1 bowl, cooked (150g) | 9.6 | 26 | White, brown or green foods? (sugar infographic) | read from infographic | |
| Brown rice, boiled | Staples | 1 bowl, cooked (150g) | 7.3 | 20 | White, brown or green foods? (sugar infographic) | read from infographic | |
| White potato, boiled | Staples | 1 medium (150g) | 9.1 | 24.8 | Common foods (sugar infographic) | read from infographic | GI 96 as printed. GL not printed on the source; back-calculated as 9.1 x 2.73 = 24.8. |
| White potato, baked | Staples | 1 medium (150g) | 8.2 | 22 | Same paper — Figure 1 and Box 1 (baked potato worked example) | read from infographic | GI 86 as printed. From the version of the common foods chart printed as Figure 1 in Unwin 2016; Box 1 works it as 17g carb per 100g x 150g = 25.5g carb, x 86 / 100 = GL 22. |
| French fries, oven baked | Staples | 1 serving (150g) | 7.5 | 21 | Common foods (sugar infographic) | read from infographic | GI 64 as printed. GL 21 and 32g available carbohydrate from Unwin 2016 Table 1. |
| Spaghetti, white, boiled | Staples | 1 plate, cooked (180g) | 6.6 | 18 | Common foods (sugar infographic) | read from infographic | GI 39 as printed. GL 18 from the white, brown or green poster and Unwin 2016 Table 1. |
| Spaghetti, wholemeal, boiled | Staples | 1 plate, cooked (180g) | 6.2 | 17 | White, brown or green foods? (sugar infographic) | read from infographic | |
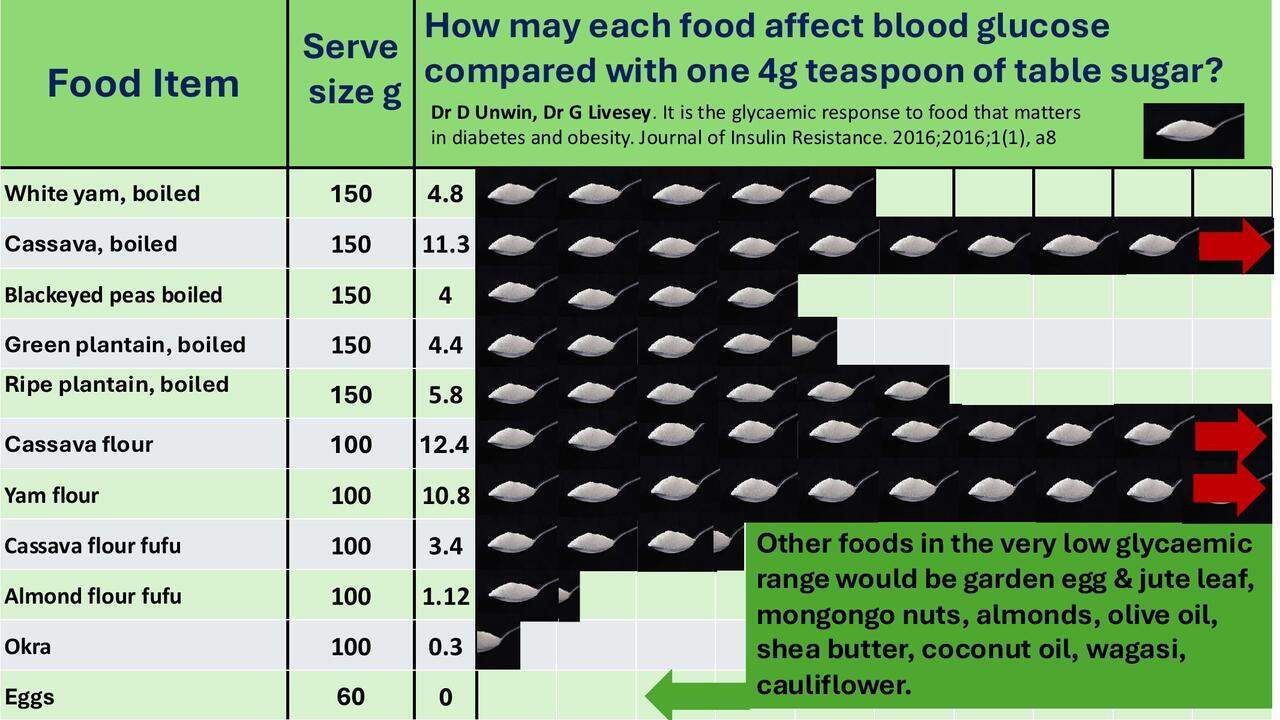
| White yam, boiled | Staples | 1 serving (150g) | 4.8 | 13.1 | African and Caribbean foods (sugar infographic) | read from infographic | GL not printed on the source; back-calculated as 4.8 x 2.73 = 13.1. |
| Cassava, boiled | Staples | 1 serving (150g) | 11.3 | 30.8 | African and Caribbean foods (sugar infographic) | read from infographic | GL not printed on the source; back-calculated as 11.3 x 2.73 = 30.8. |
| Black-eyed peas, boiled | Staples | 1 serving (150g) | 4.0 | 10.9 | African and Caribbean foods (sugar infographic) | read from infographic | GL not printed on the source; back-calculated as 4.0 x 2.73 = 10.9. |
| Green plantain, boiled | Staples | 1 serving (150g) | 4.4 | 12 | African and Caribbean foods (sugar infographic) | read from infographic | GL not printed on the source; back-calculated as 4.4 x 2.73 = 12.0. |
| Ripe plantain, boiled | Staples | 1 serving (150g) | 5.8 | 15.8 | African and Caribbean foods (sugar infographic) | read from infographic | GL not printed on the source; back-calculated as 5.8 x 2.73 = 15.8. |
| Cassava flour | Staples | 100g dry flour | 12.4 | 33.9 | African and Caribbean foods (sugar infographic) | read from infographic | GL not printed on the source; back-calculated as 12.4 x 2.73 = 33.9. |
| Yam flour | Staples | 100g dry flour | 10.8 | 29.5 | African and Caribbean foods (sugar infographic) | read from infographic | GL not printed on the source; back-calculated as 10.8 x 2.73 = 29.5. |
| Fufu made with cassava flour | Staples | 1 serving (100g) | 3.4 | 9.3 | African and Caribbean foods (sugar infographic) | read from infographic | GL not printed on the source; back-calculated as 3.4 x 2.73 = 9.3. |
| Fufu made with almond flour | Staples | 1 serving (100g) | 1.1 | 3 | African and Caribbean foods (sugar infographic) | read from infographic | GL not printed on the source; back-calculated as 1.1 x 2.73 = 3.0. Printed as 1.12; rounded to one decimal place. |
| Red lentils | Staples | 100g dry weight, before cooking | 3.5 | 9.6 | South Asian foods (sugar infographic) | read from infographic | GI 24 as printed. GL not printed on the source; back-calculated as 3.5 x 2.73 = 9.6. Poster labels the portion 'raw'. |
| Chickpeas, cooked | Staples | about 2/3 cup (100g) | 1.9 | 5.2 | South Asian foods (sugar infographic) | read from infographic | GI 28 as printed. GL not printed on the source; back-calculated as 1.9 x 2.73 = 5.2. |
| Millet, boiled | Staples | about 1/2 cup (100g) | 3.9 | 10.6 | South Asian foods (sugar infographic) | read from infographic | GI 65 as printed. GL not printed on the source; back-calculated as 3.9 x 2.73 = 10.6. |
| Dal khichdi | Staples | 1 bowl (200g) | 4.5 | 12.3 | South Asian foods (sugar infographic) | read from infographic | GI 60 as printed. GL not printed on the source; back-calculated as 4.5 x 2.73 = 12.3. |
| Sweet corn, boiled | Vegetables | about 1/2 cup (80g) | 4.0 | 11 | Common foods (sugar infographic) | read from infographic | GI 60 as printed. GL 11 and 18g available carbohydrate from Unwin 2016 Table 1. |
| Peas, frozen, boiled | Vegetables | about 1/2 cup (80g) | 1.3 | 4 | Common foods (sugar infographic) | read from infographic | GI 51 as printed. GL 4 and 7g available carbohydrate from Unwin 2016 Table 1. |
| Broccoli, boiled | Vegetables | about 1 cup (80g) | 0.2 | 0.5 | Common foods (sugar infographic) | read from infographic | GI 15 as printed. GL not printed on the source; back-calculated as 0.2 x 2.73 = 0.5. The white, brown or green poster gives 0.1 for a larger 250g portion (GL 0.3); the smaller-portion value from the common foods poster is used. |
| Cabbage | Vegetables | about 1 cup shredded (80g) | 0.1 | 0.3 | Fruits vs vegetables (sugar infographic) | read from infographic | GI 10 as printed. GL not printed on the source; back-calculated as 0.1 x 2.73 = 0.3. |
| Cauliflower | Vegetables | about 3/4 cup (80g) | 0.7 | 1.9 | It is the glycaemic response to, not the carbohydrate content of food that matters in diabetes and obesity: The glycaemic index revisited — Table 1 | published GL table | GI 60 as printed. Table 1 prints 3.2g carbohydrate and a GL of 0.32, but 3.2 x 60 / 100 = 1.9, and its own teaspoon figure (0.7 = 1.9 / 2.73) matches 1.9. GL recorded as 1.9 on that basis. |
| Tomato, raw | Vegetables | 1 small tomato (50g) | 0.3 | 0.9 | It is the glycaemic response to, not the carbohydrate content of food that matters in diabetes and obesity: The glycaemic index revisited — Table 1 | published GL table | GI 54 as printed. Table 1 prints 1.6g carbohydrate and a GL of 0.24, but 1.6 x 54 / 100 = 0.86, and its teaspoon figure (0.3) matches 0.86. The paper states the GI for this food was estimated from composition and is likely to be overestimated. |
| Mushrooms | Vegetables | about 1 cup sliced (80g) | 0.1 | 0.2 | It is the glycaemic response to, not the carbohydrate content of food that matters in diabetes and obesity: The glycaemic index revisited — Table 1 | published GL table | GI 70 as printed. Table 1 prints 0.3g carbohydrate and GL 0.03; 0.3 x 70 / 100 = 0.21, which matches its teaspoon figure. The paper states the GI was estimated from composition and is likely to be overestimated. |
| Okra | Vegetables | about 1 cup (100g) | 0.3 | 0.8 | African and Caribbean foods (sugar infographic) | read from infographic | GL not printed on the source; back-calculated as 0.3 x 2.73 = 0.8. |
| Bitter gourd | Vegetables | 1 serving (100g) | 0.1 | 0.3 | South Asian foods (sugar infographic) | read from infographic | GI 15 as printed. GL not printed on the source; back-calculated as 0.1 x 2.73 = 0.3. |
| Milk, whole | Dairy | 1 large glass (250ml) | 2.0 | 5 | It is the glycaemic response to, not the carbohydrate content of food that matters in diabetes and obesity: The glycaemic index revisited — Table 1 | published GL table | GI 46 as printed. Table 1 lists 12g available carbohydrate. The a healthy breakfast poster gives 1.0 for 125ml of milk, consistent with this. |
| Greek-style yogurt | Dairy | 1 pot (200g) | 0.4 | 1 | It is the glycaemic response to, not the carbohydrate content of food that matters in diabetes and obesity: The glycaemic index revisited — Table 1 | published GL table | GI 12 as printed. Table 1 lists 8g available carbohydrate. |
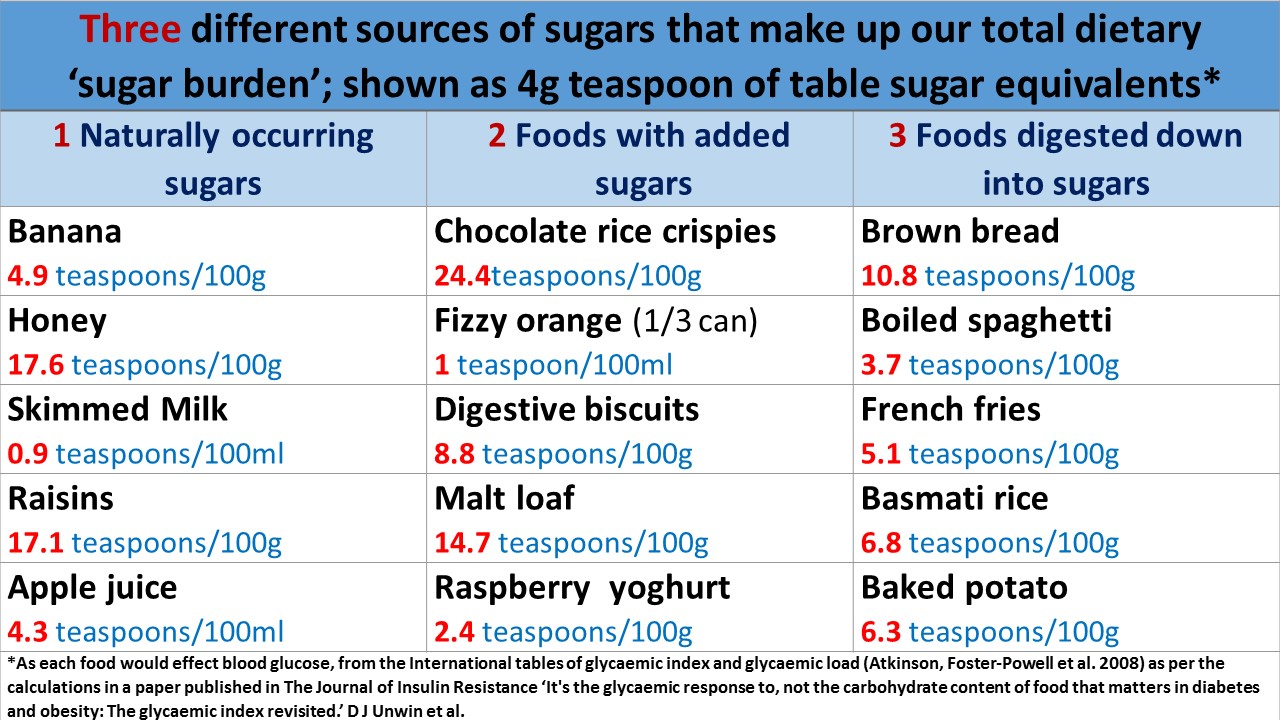
| Raspberry yogurt | Dairy | 100g | 2.4 | 6.6 | The sugar burden (sugar infographic) | read from infographic | GL not printed on the source; back-calculated as 2.4 x 2.73 = 6.6. The sugar burden poster gives values per 100g. |
| Raita | Dairy | 1 serving (100g) | 0.2 | 0.5 | South Asian foods (sugar infographic) | read from infographic | GI 20 as printed. GL not printed on the source; back-calculated as 0.2 x 2.73 = 0.5. |
| Apple juice, pure | Drinks | 1 glass (200ml) | 4.0 | 10.9 | A healthy breakfast: cereals, toast, fruit juice? (sugar infographic) | read from infographic | GL not printed on the source; back-calculated as 4.0 x 2.73 = 10.9. The sugar burden poster gives apple juice as 4.3 per 100ml, which would be 8.6 for 200ml. The two posters disagree; the a healthy breakfast value is used and the conflict is listed on the sources page. |
| Mango juice | Drinks | 1 glass (200ml) | 5.0 | 13.7 | South Asian foods (sugar infographic) | read from infographic | GI 55 as printed. GL not printed on the source; back-calculated as 5.0 x 2.73 = 13.7. |
| Digestive biscuits, plain | Snacks and sweets | 25g (a little under 2 biscuits) | 2.3 | 6 | It is the glycaemic response to, not the carbohydrate content of food that matters in diabetes and obesity: The glycaemic index revisited — Table 1 | published GL table | GI 39 as printed. Table 1 lists 16g available carbohydrate. The sugar burden poster gives 8.8 per 100g, which is 2.2 per 25g, consistent with this. |
| Malt loaf | Snacks and sweets | 100g | 14.7 | 40.1 | The sugar burden (sugar infographic) | read from infographic | GL not printed on the source; back-calculated as 14.7 x 2.73 = 40.1. The sugar burden poster gives values per 100g. A UK sticky fruit loaf. |
| Honey | Snacks and sweets | 100g (about 5 tablespoons) | 17.6 | 48 | The sugar burden (sugar infographic) | read from infographic | GL not printed on the source; back-calculated as 17.6 x 2.73 = 48.0. The sugar burden poster gives values per 100g. Tablespoon equivalent uses 21g per tablespoon (USDA FoodData Central). |
| Poppadom | Snacks and sweets | 1 poppadom (9g) | 1.5 | 4.1 | South Asian foods (sugar infographic) | read from infographic | GI 70 as printed. GL not printed on the source; back-calculated as 1.5 x 2.73 = 4.1. |
| Eggs | Meat, fish and eggs | 1 large egg (60g) | 0.0 | 0 | Common foods (sugar infographic) | read from infographic | GI 0 as printed. Also shown as 0 on the African and Caribbean foods poster. |
| Chicken breast, roasted | Meat, fish and eggs | 1 portion (100g) | 0.0 | 0 | FoodData Central (SR Legacy): FDC IDs 171477, 175168, 174032 | calculated from GI and carb content | Carbohydrate 0.0g per 100g (USDA FoodData Central, SR Legacy FDC ID 171477). With no carbohydrate, GL = GI x 0 / 100 = 0 whatever the GI; no GI value is measurable or needed. PHC posters list chicken in the very low glycaemic range. |
| Salmon, cooked | Meat, fish and eggs | 1 fillet (100g) | 0.0 | 0 | FoodData Central (SR Legacy): FDC IDs 171477, 175168, 174032 | calculated from GI and carb content | Carbohydrate 0.0g per 100g (USDA FoodData Central, SR Legacy FDC ID 175168, Atlantic farmed, dry heat). GL = GI x 0 / 100 = 0. PHC posters list oily fish in the very low glycaemic range. |
| Ground beef patty, 85% lean | Meat, fish and eggs | 1 patty (100g) | 0.0 | 0 | FoodData Central (SR Legacy): FDC IDs 171477, 175168, 174032 | calculated from GI and carb content | Carbohydrate 0.0g per 100g (USDA FoodData Central, SR Legacy FDC ID 174032). GL = GI x 0 / 100 = 0. PHC posters list meat in the very low glycaemic range. |

Where the published sources disagree
The charts were drawn at different times from different table entries, and a few figures do not match from one chart to the next. None of these has been adjusted. The value used, and the other value, are recorded here.
- Banana, 120g: 5.9 on the fruits chart (used); 5.7 on the common foods and fruits vs vegetables charts.
- Apple, 120g: 2.2 on the fruits chart (used); 2.3 on the common foods chart and in Table 1 of the paper.
- Brown or wholemeal bread, 30g slice: 3.3 on the bread chart (used); 3.0 on the common foods chart.
- Cornflakes, 30g: 8.4 on the breakfast cereals chart (used); 8.5 in Table 1.
- Bran flakes, 30g: both give 3.7, but the chart lists GI 74 and Table 1 lists GI 50.
- Broccoli: 0.2 for 80g on the common foods chart (used); 0.1 for 250g on the white, brown or green chart.
- Apple juice: 4.0 for 200ml on the healthy breakfast chart (used); 4.3 per 100ml on the sugar burden chart, which would be 8.6 for 200ml.
- Bread, two slices (60g): the white, brown or green chart gives 8 (white) and 6 (brown), which are not exactly double the single-slice figures of 3.7 and 3.3. The calculator uses the single-slice chart.
- Cauliflower, tomato and mushrooms (Table 1): the printed glycaemic load column (0.32, 0.24, 0.03) does not equal GI × carbohydrate ÷ 100 (1.9, 0.9, 0.2), but the printed teaspoon figures match the calculated loads. The teaspoon figures are used as printed, and the GL column here holds the calculated load.
Foods left out
These appear on the charts or were considered, and were not included.
- Couscous (Table 1): listed as 150g rehydrated with 14g of available carbohydrate and 3.3 teaspoons. That carbohydrate figure is well below typical values for cooked couscous, and the discrepancy could not be resolved from the paper.
- Fizzy orange, skimmed milk and apple juice per 100ml (sugar burden chart): the drink figures on this chart are not consistent with the other charts, so none of them is used.
- Chocolate: the chocolate chart counts grams of sugar per bar, not glycaemic load, so its figures are a different measure.
- Beans and pulses chart: found only in translated sets. The Public Health Collaboration notes that translations have not been independently verified.
- Cheese, nuts, olive oil, spinach, salad leaves, courgette and similar: the charts list these as very low glycaemic foods but print no figure for them.
- Duplicates: foods that appear on more than one chart with the same portion are listed once.
No foods were added from other GI tables. The Harvard Health GI and GL list sits behind a subscription wall, and the online appendix of the 2008 international tables could not be retrieved, so neither was used as a direct source.
Reference list
-
Common foods (sugar infographic)
Dr David Unwin. Public Health Collaboration.
https://phcuk.org/images/sugar/common-foods.jpg
Accessed 2026-09-13. No licence statement found on https://phcuk.org/sugar/ when accessed (page footer: © Public Health Collaboration). Distributed by PHC as free downloads. Attributed here in the form CC BY 4.0 requires.
-
Bread (sugar infographic)
Dr David Unwin. Public Health Collaboration.
https://phcuk.org/images/sugar/bread.jpg
Accessed 2026-09-13. No licence statement found on https://phcuk.org/sugar/ when accessed (page footer: © Public Health Collaboration). Distributed by PHC as free downloads. Attributed here in the form CC BY 4.0 requires.
-
Breakfast cereals (sugar infographic)
Dr David Unwin. Public Health Collaboration.
https://phcuk.org/images/sugar/breakfast-cereals.jpg
Accessed 2026-09-13. No licence statement found on https://phcuk.org/sugar/ when accessed (page footer: © Public Health Collaboration). Distributed by PHC as free downloads. Attributed here in the form CC BY 4.0 requires.
-
Fruits (sugar infographic)
Dr David Unwin. Public Health Collaboration.
https://phcuk.org/images/sugar/fruits.jpg
Accessed 2026-09-13. No licence statement found on https://phcuk.org/sugar/ when accessed (page footer: © Public Health Collaboration). Distributed by PHC as free downloads. Attributed here in the form CC BY 4.0 requires.
-
Fruits vs vegetables (sugar infographic)
Dr David Unwin. Public Health Collaboration.
https://phcuk.org/images/sugar/fruits-vegetables.jpg
Accessed 2026-09-13. No licence statement found on https://phcuk.org/sugar/ when accessed (page footer: © Public Health Collaboration). Distributed by PHC as free downloads. Attributed here in the form CC BY 4.0 requires.
-
White, brown or green foods? (sugar infographic)
Dr David Unwin. Public Health Collaboration.
https://phcuk.org/images/sugar/white-brown-green-foods.jpg
Accessed 2026-09-13. No licence statement found on https://phcuk.org/sugar/ when accessed (page footer: © Public Health Collaboration). Distributed by PHC as free downloads. Attributed here in the form CC BY 4.0 requires.
-
A healthy breakfast: cereals, toast, fruit juice? (sugar infographic)
Dr David Unwin. Public Health Collaboration.
https://phcuk.org/images/sugar/common-breakfast.png
Accessed 2026-09-13. No licence statement found on https://phcuk.org/sugar/ when accessed (page footer: © Public Health Collaboration). Distributed by PHC as free downloads. Attributed here in the form CC BY 4.0 requires.
-
The sugar burden (sugar infographic)
Dr David Unwin. Public Health Collaboration.
https://phcuk.org/images/sugar/sugar-burden.jpg
Accessed 2026-09-13. No licence statement found on https://phcuk.org/sugar/ when accessed (page footer: © Public Health Collaboration). Distributed by PHC as free downloads. Attributed here in the form CC BY 4.0 requires.
-
African and Caribbean foods (sugar infographic)
Dr David Unwin and Dr Geoffrey Livesey. Public Health Collaboration.
https://phcuk.org/images/sugar/african-caribbean-foods.jpg
Accessed 2026-09-13. No licence statement found on https://phcuk.org/sugar/ when accessed (page footer: © Public Health Collaboration). Distributed by PHC as free downloads. Attributed here in the form CC BY 4.0 requires.
-
South Asian foods (sugar infographic)
Dr David Unwin. Public Health Collaboration.
https://phcuk.org/images/sugar/south-asian-foods.jpg
Accessed 2026-09-13. No licence statement found on https://phcuk.org/sugar/ when accessed (page footer: © Public Health Collaboration). Distributed by PHC as free downloads. Attributed here in the form CC BY 4.0 requires.
-
It is the glycaemic response to, not the carbohydrate content of food that matters in diabetes and obesity: The glycaemic index revisited — Table 1
Unwin D, Haslam D, Livesey G. Journal of Insulin Resistance 2016;1(1):a8 (journal now published as the Journal of Metabolic Health). DOI 10.4102/jir.v1i1.8.
https://journalofmetabolichealth.org/index.php/jmh/article/view/8
Accessed 2026-09-13. Journal states all articles are published under Creative Commons Attribution 4.0 International (CC BY 4.0) unless otherwise stated. The article page's own licence field reads 'Other'. © 2016 David Unwin, David Haslam, Geoffrey Livesey.
-
Same paper — Figure 1 and Box 1 (baked potato worked example)
Unwin D, Haslam D, Livesey G. Journal of Insulin Resistance 2016;1(1):a8. DOI 10.4102/jir.v1i1.8.
https://journalofmetabolichealth.org/index.php/jmh/article/download/8/9
Accessed 2026-09-13. As above.
-
FoodData Central (SR Legacy): FDC IDs 171477, 175168, 174032
U.S. Department of Agriculture, Agricultural Research Service. USDA.
Accessed 2026-09-13. Public domain (U.S. Government work).
-
Four grams of glucose
Wasserman DH. American Journal of Physiology — Endocrinology and Metabolism 2009;296(1):E11–E21. DOI 10.1152/ajpendo.90563.2008. PMCID PMC2636990.
https://pmc.ncbi.nlm.nih.gov/articles/PMC2636990/
Accessed 2026-09-13. Cited, not reproduced. Used only for the bloodstream glucose figure.
-
International tables of glycemic index and glycemic load values: 2008
Atkinson FS, Foster-Powell K, Brand-Miller JC. Diabetes Care 2008;31(12):2281–2283. DOI 10.2337/dc08-1239.
https://pmc.ncbi.nlm.nih.gov/articles/PMC2584181/
Accessed 2026-09-13. Cited, not reproduced. The GI values printed on the PHC infographics and in Unwin 2016 Table 1 are taken from these tables.
Reporting an error
If a value here does not match its source, or a better source exists, please write in through the contact page and include the source. Values are re-checked against the sources above twice a year.