Porridge is the only cereal on Dr Unwin’s breakfast cereals chart measured cooked rather than dry, and the only one measured by volume. The chart gives a serving of 150ml. That is oats already cooked in water or milk, not a weight of dry oats, and the chart does not state the ratio of oats to liquid, whether milk or water was used, or what kind of oats were cooked.
Those details change the result. A thick porridge contains more oats in 150ml than a thin one. Jumbo oats and steel-cut oats are less processed than instant oats, and instant oat products tend to be listed with higher GI values in the published tables. One figure for one measured serving stands in for all of those.
The chart gives a glycaemic index of 63, in the medium band. It prints a teaspoon figure but no glycaemic load, and the load here was back-calculated from it.
150ml is a volume, and the weight of porridge that fills it depends on how thick the porridge is. Toppings such as honey, fruit or syrup are separate foods with their own figures, and so is milk poured over the top.
Oats appear elsewhere in the dataset in a different form, baked into a wheat loaf: oatmeal bread, from the bread chart.
The numbers
- Glycaemic index
- 63
- Available carbohydrate
- not printed on this source
- Glycaemic load
- 12, back-calculated from the teaspoon figure
- Teaspoons
- 4.4
Teaspoons printed on the source: 4.4
Glycaemic load: 4.4 × 2.73 = 12
Source
Read from a published chart: Breakfast cereals (sugar infographic). Dr David Unwin. Public Health Collaboration.
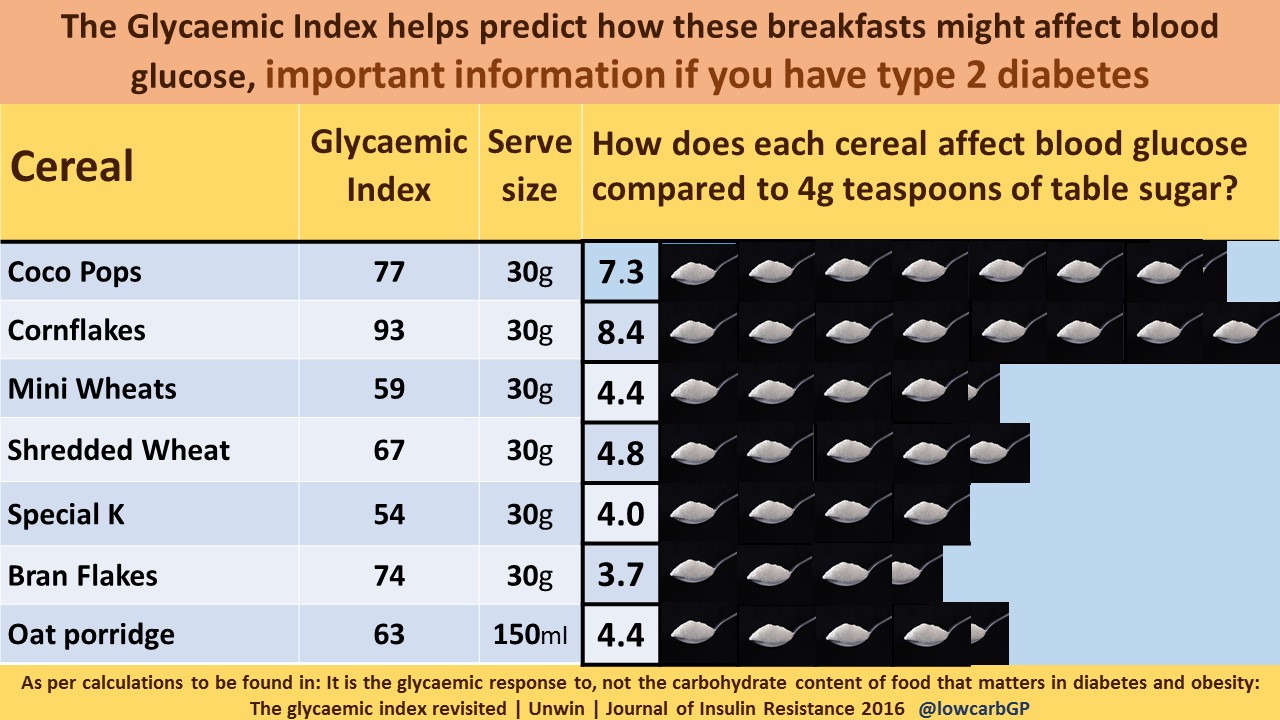
The teaspoon-of-sugar method is the work of Dr David Unwin, and his sugar infographics are published by the Public Health Collaboration at phcuk.org/sugar and used here with PHC's permission. Full provenance for every food is on the sources page.