The bread chart lists this loaf as “Oatmeal batch”. A batch loaf is a Scottish and northern English style: the loaves are baked packed together, so they rise upwards rather than outwards, with soft sides where they touched and a firm crust only on the top and bottom. An oatmeal batch adds oats or oatmeal to what is otherwise a wheat dough.
The glycaemic index printed for it is 62, in the medium band, between the chart’s white loaf and its stoneground wholemeal loaf. The glycaemic load of 9 and the teaspoon figure are both printed on the chart, for its standard 30g slice.
Oats are often discussed apart from wheat in nutrition writing because they contain a soluble fibre, beta-glucan. In a bread like this, oats are one ingredient among several, and the chart does not say how much of the flour they make up. The figure describes the tested loaf, not oats as a grain.
Batch loaves are sold in Scotland under several bakery names, and recipes differ in how much oatmeal they contain and whether it is mixed into the dough or scattered on the crust.
Oats appear in a very different form on the breakfast cereals chart, as porridge measured by volume: oat porridge.
The numbers
- Glycaemic index
- 62
- Available carbohydrate
- not printed on this source
- Glycaemic load
- 9, as printed on the source
- Teaspoons
- 3.3
Glycaemic load printed on the source: 9
Teaspoons: 9 ÷ 2.73 = 3.3
Source
Read from a published chart: Bread (sugar infographic). Dr David Unwin. Public Health Collaboration.
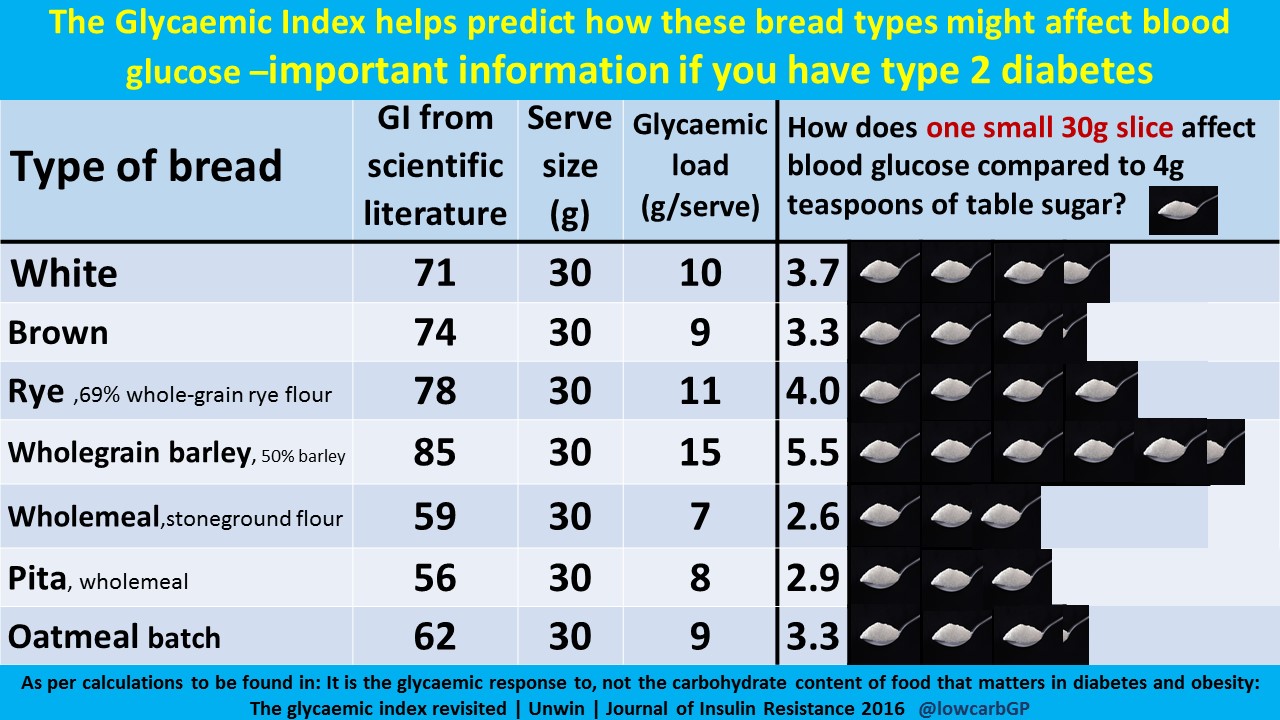
The teaspoon-of-sugar method is the work of Dr David Unwin, and his sugar infographics are published by the Public Health Collaboration at phcuk.org/sugar and used here with PHC's permission. Full provenance for every food is on the sources page.
Side by side
-
Oatmeal bread
1 small slice (30g)
3.3 teaspoons
- Salmon, cooked
1 fillet (100g)
0.0 teaspoons
- Nectarine
1 medium (120g)
1.5 teaspoons