An egg is the only food on Dr Unwin’s charts printed with a glycaemic index of 0. It closes both the common foods chart and the African and Caribbean foods chart, each time at 60g, the weight of one large egg, and each time with a teaspoon figure of 0.
Eggs contain very little carbohydrate, well under a gram in a large egg. There is not enough to measure a glycaemic index in the usual way, since a GI test needs a portion containing a fixed amount of carbohydrate. The GI of 0 on the charts expresses that rather than a result from volunteers.
The glycaemic load follows. A GI of 0, multiplied by any amount of carbohydrate and divided by 100, is a load of 0, and a teaspoon figure of 0.
The figure applies to eggs boiled, poached, scrambled or fried: cooking changes the protein and, with oil or butter, adds fat, but it does not add carbohydrate. It does not apply to dishes that combine eggs with flour, milk or sugar, such as pancakes, quiche or custard.
On the common foods chart, the row above eggs is broccoli, and a side panel names chicken, oily fish, almonds, mushrooms, cheese and meat as foods in the very low range. Three of those have figures on this site, calculated from USDA carbohydrate data: chicken breast, salmon and ground beef.
The numbers
- Glycaemic index
- 0
- Available carbohydrate
- not printed on this source
- Glycaemic load
- 0, calculated
- Teaspoons
- 0.0
Glycaemic load: GI 0 × any carbohydrate ÷ 100 = 0
Teaspoons: 0 ÷ 2.73 = 0.0
Source
Read from a published chart: Common foods (sugar infographic). Dr David Unwin. Public Health Collaboration.
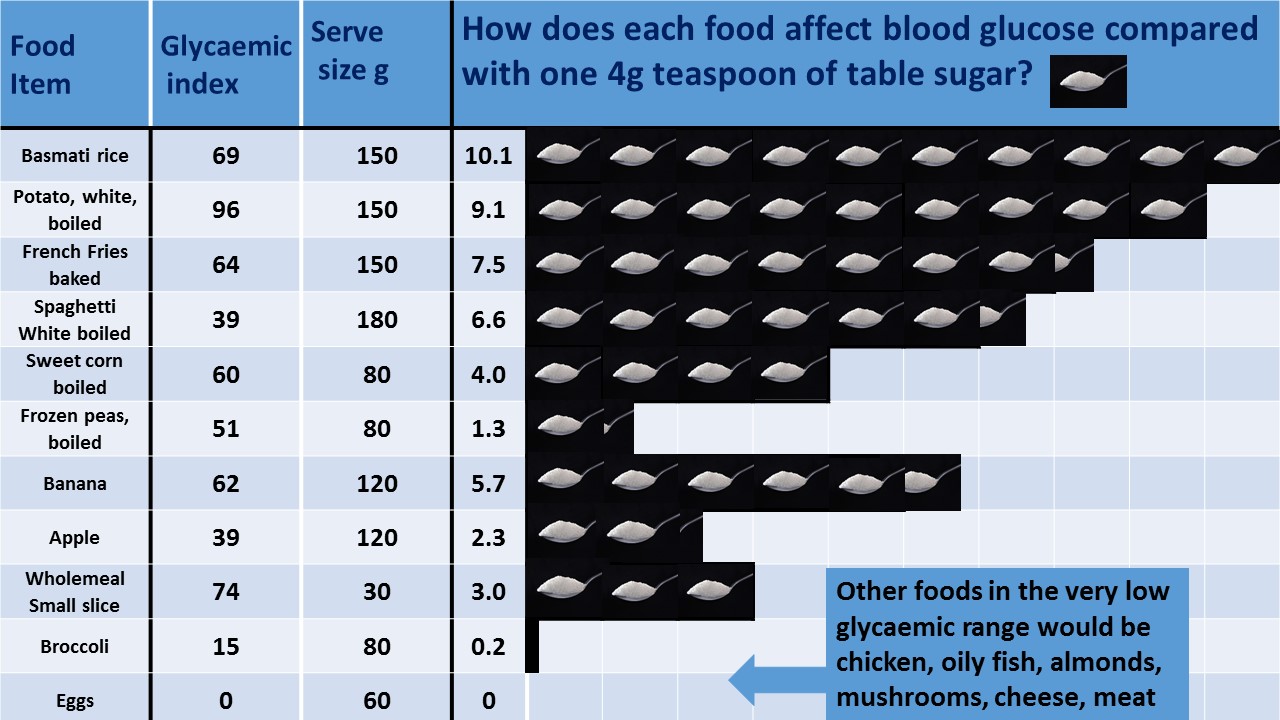
The teaspoon-of-sugar method is the work of Dr David Unwin, and his sugar infographics are published by the Public Health Collaboration at phcuk.org/sugar and used here with PHC's permission. Full provenance for every food is on the sources page.
Side by side
-
Eggs
1 large egg (60g)
0.0 teaspoons
- Cornflakes
1 bowl, dry (30g)
8.4 teaspoons
- White bread
1 small slice (30g)
3.7 teaspoons