Ripe plantain has yellow skin turning black, soft flesh and a sweet taste. It is the form fried as dodo in Nigeria, kelewele in Ghana and maduros in the Spanish-speaking Caribbean. Here it is boiled. The African and Caribbean foods chart lists it at a 150g serving, directly below green plantain.
As a plantain ripens, much of the starch in the green fruit is converted to sugars, mainly sucrose, glucose and fructose. The chart shows the result for a boiled serving at each stage, and gives no explanation beyond the figures.
No glycaemic index or glycaemic load is printed for either plantain. The load on this page was back-calculated from the teaspoon figure.
Frying adds oil, and fried ripe plantain is a different preparation from the boiled plantain measured here. The chart has no fried row.
Ripeness is a spectrum rather than two stages, and the chart does not say how ripe its “ripe” plantain was. A plantain with a few black patches and one that is fully black and soft would not be expected to give the same result.
The first row of the pair is on the green plantain page. Other boiled staples on the same chart include white yam and cassava.
The numbers
- Glycaemic index
- not printed on this source
- Available carbohydrate
- not printed on this source
- Glycaemic load
- 15.8, back-calculated from the teaspoon figure
- Teaspoons
- 5.8
Teaspoons printed on the source: 5.8
Glycaemic load: 5.8 × 2.73 = 15.8
Source
Read from a published chart: African and Caribbean foods (sugar infographic). Dr David Unwin and Dr Geoffrey Livesey. Public Health Collaboration.
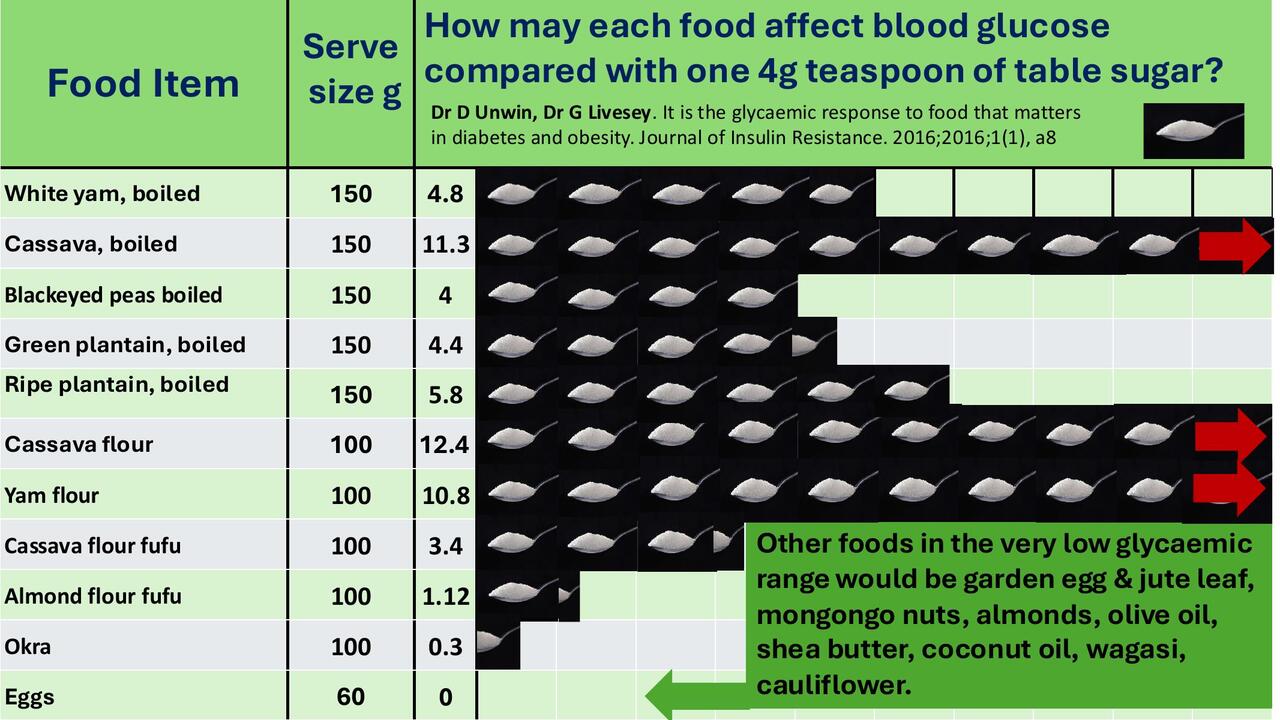
The teaspoon-of-sugar method is the work of Dr David Unwin, and his sugar infographics are published by the Public Health Collaboration at phcuk.org/sugar and used here with PHC's permission. Full provenance for every food is on the sources page.
Side by side
-
Ripe plantain, boiled
1 serving (150g)
5.8 teaspoons
- Green plantain, boiled
1 serving (150g)
4.4 teaspoons
- Salmon, cooked
1 fillet (100g)
0.0 teaspoons