White rice comes from the chart titled “White, brown or green foods?”, which sets three white staples against their brown versions and against one green vegetable: rice, bread and spaghetti, then broccoli. The chart’s footnote says the rice was boiled. It does not name a variety, and long-grain, short-grain, jasmine, sticky and basmati rices are listed with quite different values in the GI tables.
This chart has no glycaemic index column. It prints a glycaemic load and a serve size instead, so no GI is given on this page. For a 150g bowl the chart prints a load of 26 and a teaspoon figure of 9.6.
Those two printed figures do not quite agree. Divided by the glycaemic load of one teaspoon of sugar, 26 gives 9.5, not 9.6. The chart does not explain the difference. The printed teaspoon figure is used, as it is for every food on this site, and the discrepancy is listed on the sources page.
White rice is rice with the bran and germ milled away, leaving the starchy endosperm, which is then polished. What remains is almost entirely starch, and the milling also lets it cook faster and keep longer than brown rice.
A 150g bowl is a moderate serving of cooked rice. In the calculator, two portions count as twice the figure.
Basmati rice, from the common foods chart, has its own page with the full working from Table 1 of the 2016 paper.
The numbers
- Glycaemic index
- not printed on this source
- Available carbohydrate
- not printed on this source
- Glycaemic load
- 26, as printed on the source
- Teaspoons
- 9.6
Glycaemic load printed on the source: 26
Teaspoons: 26 ÷ 2.73 = 9.5
Worked through, the arithmetic gives 9.5. The source prints 9.6, and the printed figure is the one used here.
Source
Read from a published chart: White, brown or green foods? (sugar infographic). Dr David Unwin. Public Health Collaboration.
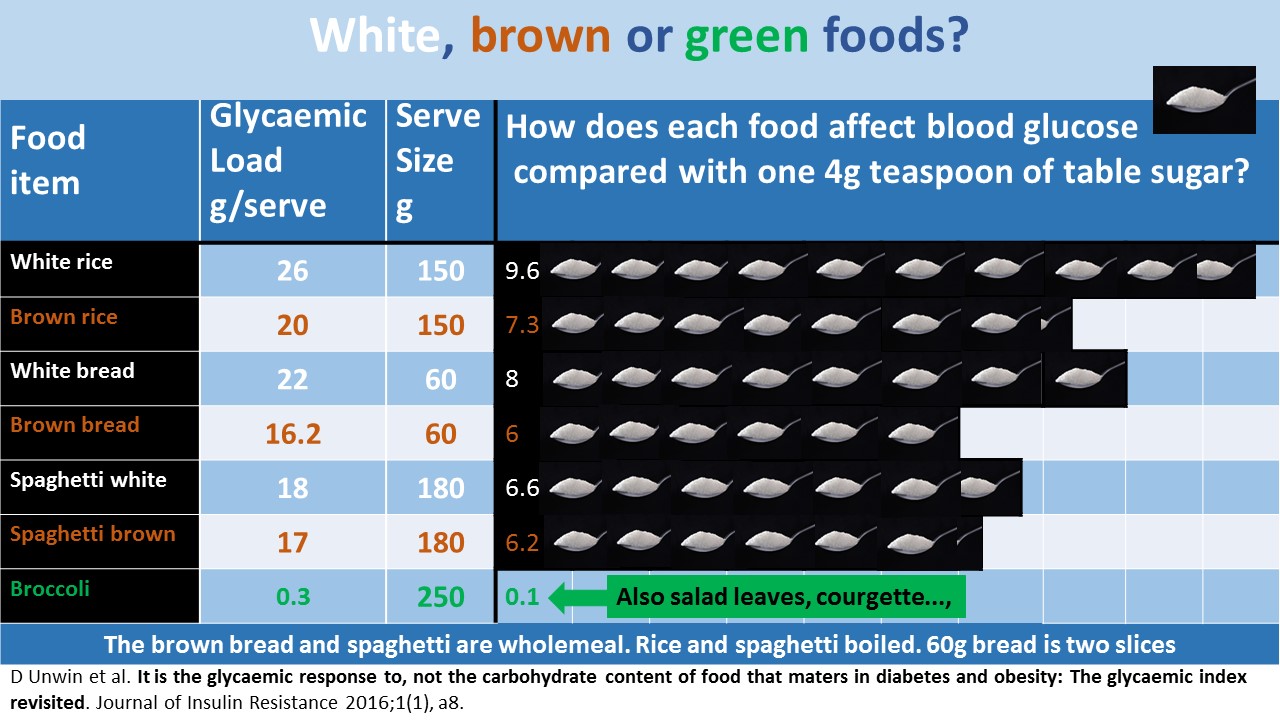
The teaspoon-of-sugar method is the work of Dr David Unwin, and his sugar infographics are published by the Public Health Collaboration at phcuk.org/sugar and used here with PHC's permission. Full provenance for every food is on the sources page.
Side by side
-
White rice, boiled
1 bowl, cooked (150g)
9.6 teaspoons
- Broccoli, boiled
about 1 cup (80g)
0.2 teaspoons
- Salmon, cooked
1 fillet (100g)
0.0 teaspoons