Raisins are dried grapes. Most are made from seedless green grape varieties, dried in the sun or in dehydrators until they lose most of their water, which darkens them. Sultanas and currants are close relatives made from different grapes or dried in different ways.
Dr Unwin’s fruits vs vegetables chart lists raisins at 60g, about a third of a cup. That is half the 120g weight the fruits chart uses for fresh fruit. The chart gives a glycaemic index of 64, in the medium band.
The chart prints the teaspoon figure but no glycaemic load, so the load here was back-calculated.
A second chart supports the figure. The sugar burden chart places raisins in its column of naturally occurring sugars, at 17.1 teaspoons per 100g. Scaled to 60g, that is 10.3, matching the fruits vs vegetables chart.
The fruits vs vegetables chart is arranged in two blocks. Boiled potato, sweet corn, frozen peas and cabbage come first; raisins lead the fruit rows, above banana, apple and strawberry.
Small snack boxes of raisins weigh much less than 60g, and the figure scales with weight. In baking, raisins are one ingredient among several, as in malt loaf, which the sugar burden chart lists separately under foods with added sugars.
The numbers
- Glycaemic index
- 64
- Available carbohydrate
- not printed on this source
- Glycaemic load
- 28.1, back-calculated from the teaspoon figure
- Teaspoons
- 10.3
Teaspoons printed on the source: 10.3
Glycaemic load: 10.3 × 2.73 = 28.1
Source
Read from a published chart: Fruits vs vegetables (sugar infographic). Dr David Unwin. Public Health Collaboration.
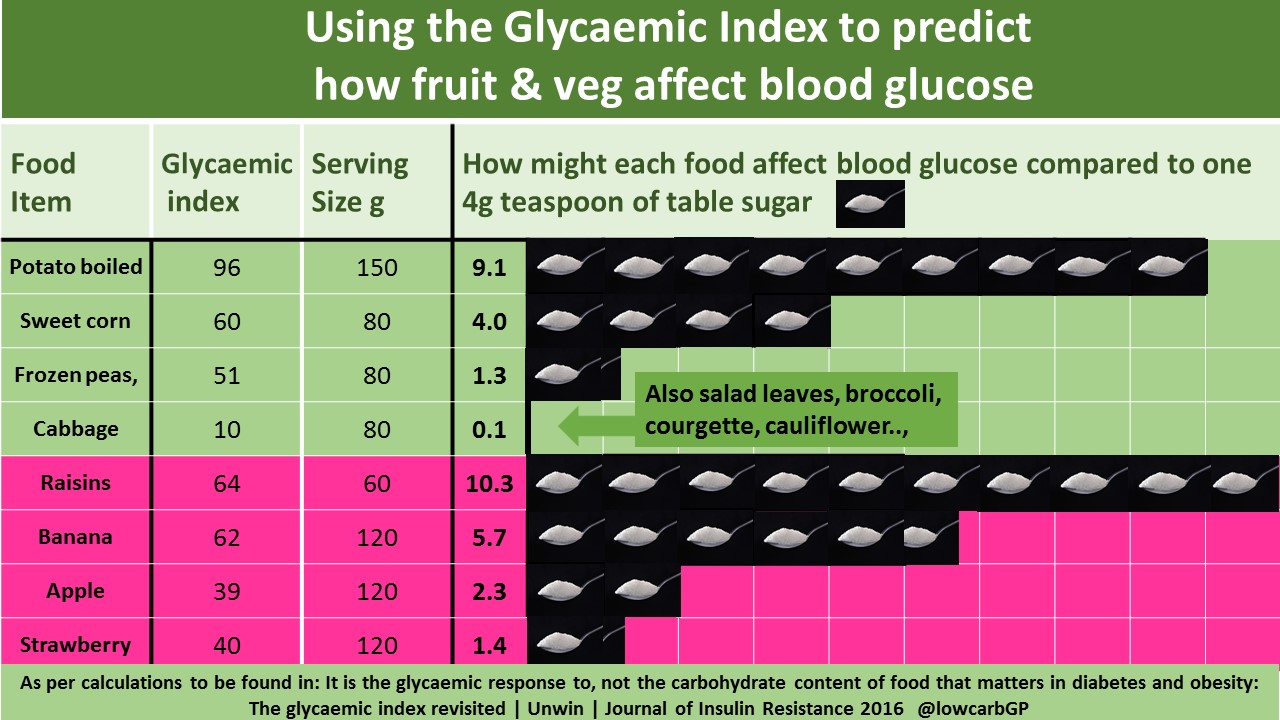
The teaspoon-of-sugar method is the work of Dr David Unwin, and his sugar infographics are published by the Public Health Collaboration at phcuk.org/sugar and used here with PHC's permission. Full provenance for every food is on the sources page.
Side by side
-
Raisins
about 1/3 cup (60g)
10.3 teaspoons
- Black grapes
about 20 grapes (120g)
4.0 teaspoons
- Broccoli, boiled
about 1 cup (80g)
0.2 teaspoons