A 120g portion of black grapes is about 20 grapes, though the count depends on the variety: seedless table grapes range from small to large. Dr Unwin’s fruits chart specifies black grapes and weighs every fruit at 120g, so the seven fruits on it can be read against each other directly.
Nearly all of the carbohydrate in grapes is sugar rather than starch, split roughly evenly between glucose and fructose. Fructose raises blood glucose far less than glucose does, which is one reason fruits with similar total sugar can have different GI values. The chart gives black grapes a glycaemic index of 59.
The chart prints both the glycaemic load, 11, and the teaspoon figure, so neither was calculated for this page.
The sugar content of grapes depends on the variety and on how ripe they were when picked, and the chart gives one value for black grapes in general.
Dried grapes appear in two other sources. Raisins are on the fruits vs vegetables chart at a 60g portion, and dried mixed fruit, mostly vine fruit, is in Table 1 of the 2016 paper. Drying removes most of the water, so a given weight of dried fruit is made from a much larger weight of fresh grapes.
Grape juice and wine are not in this dataset.
The numbers
- Glycaemic index
- 59
- Available carbohydrate
- not printed on this source
- Glycaemic load
- 11, as printed on the source
- Teaspoons
- 4.0
Glycaemic load printed on the source: 11
Teaspoons: 11 ÷ 2.73 = 4.0
Source
Read from a published chart: Fruits (sugar infographic). Dr David Unwin. Public Health Collaboration.
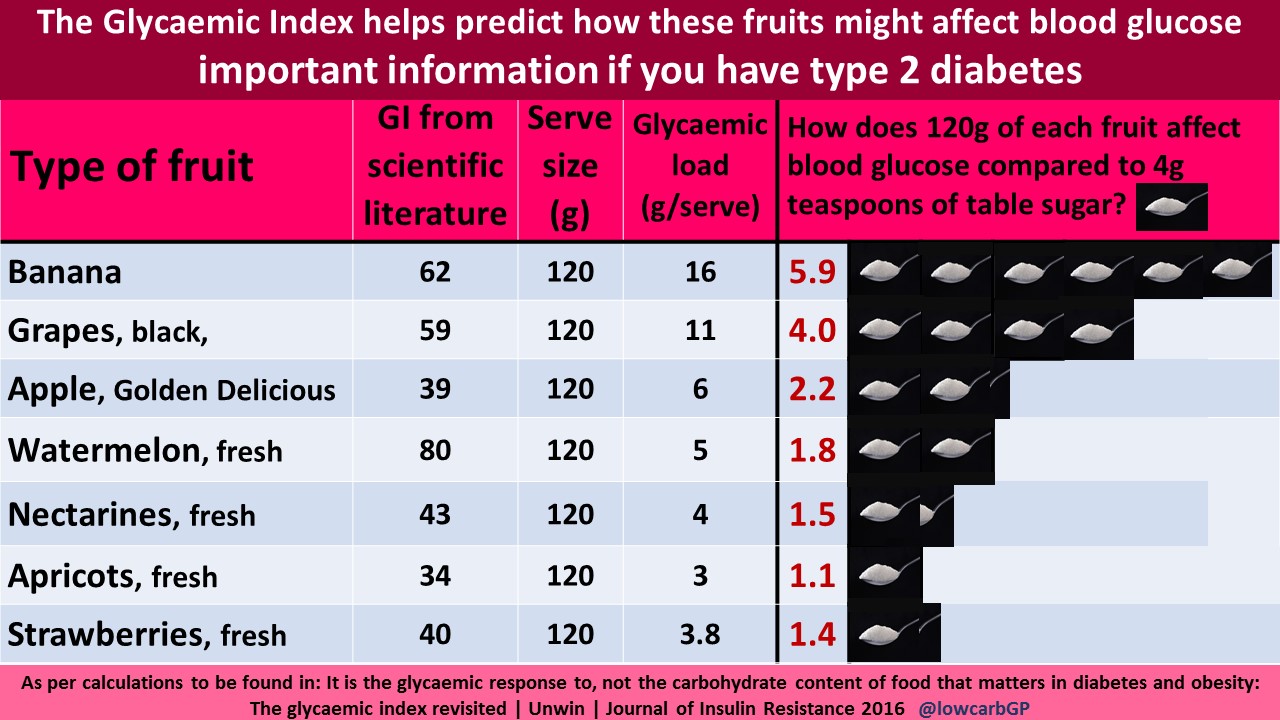
The teaspoon-of-sugar method is the work of Dr David Unwin, and his sugar infographics are published by the Public Health Collaboration at phcuk.org/sugar and used here with PHC's permission. Full provenance for every food is on the sources page.
Side by side
-
Black grapes
about 20 grapes (120g)
4.0 teaspoons
- Raisins
about 1/3 cup (60g)
10.3 teaspoons
- Cauliflower
about 3/4 cup (80g)
0.7 teaspoons
- Apple (Golden Delicious)
1 small apple (120g)
2.2 teaspoons