Watermelon is the food most often used to show why glycaemic index on its own can mislead. On Dr Unwin’s fruits chart it has the highest GI of the seven fruits, 80, well inside the band called high. Its glycaemic load, printed on the same row, is 5.
Both numbers are right at once because they answer different questions. GI is measured on an amount of watermelon containing a fixed quantity of carbohydrate, usually 50g, whatever weight of fruit that takes. Watermelon is mostly water, so an ordinary portion holds only a modest amount of carbohydrate. Glycaemic load multiplies the GI by the carbohydrate actually in the portion.
The portion here is 120g, the weight the fruits chart uses for every fruit: about three quarters of a cup of diced flesh, without rind or seeds. A wedge cut from a large melon can weigh several times that.
The sugar in a watermelon depends on the variety and on how ripe it was when cut, and the chart gives a single figure for fresh watermelon in general.
The site’s explainer what is glycaemic load opens its table of foods ranked by GI with watermelon, alongside each food’s teaspoon figure.
The numbers
- Glycaemic index
- 80
- Available carbohydrate
- not printed on this source
- Glycaemic load
- 5, as printed on the source
- Teaspoons
- 1.8
Glycaemic load printed on the source: 5
Teaspoons: 5 ÷ 2.73 = 1.8
Source
Read from a published chart: Fruits (sugar infographic). Dr David Unwin. Public Health Collaboration.
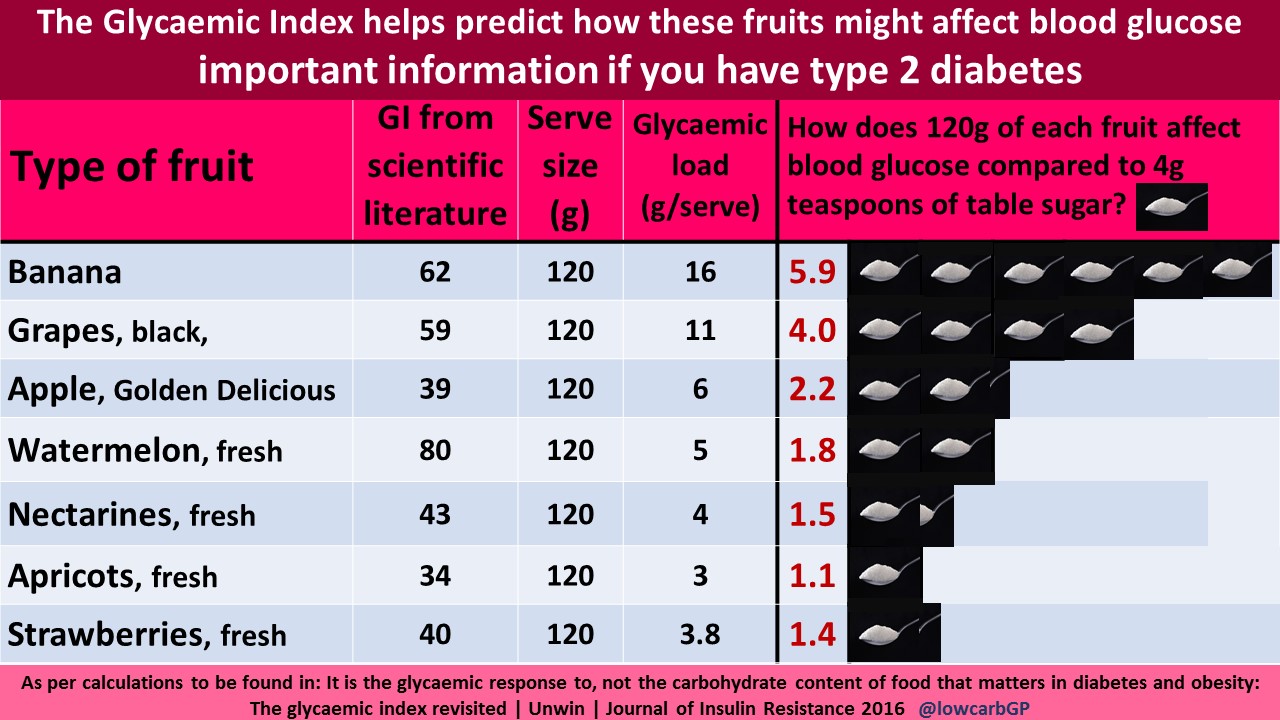
The teaspoon-of-sugar method is the work of Dr David Unwin, and his sugar infographics are published by the Public Health Collaboration at phcuk.org/sugar and used here with PHC's permission. Full provenance for every food is on the sources page.
Side by side
-
Watermelon
about 3/4 cup diced (120g)
1.8 teaspoons
- Raisins
about 1/3 cup (60g)
10.3 teaspoons
- Tomato, raw
1 small tomato (50g)
0.3 teaspoons