Strawberries appear on two of Dr Unwin’s charts, the fruits chart and the fruits vs vegetables chart. Both print the same glycaemic index and the same teaspoon figure for a 120g portion, about eight medium berries. The fruits chart, used here, also prints a glycaemic load of 3.8, the only load on that chart given with a decimal place.
Strawberries are mostly water. The carbohydrate they contain is largely sugar, a mix of glucose, fructose and a little sucrose, with some fibre. The chart gives a GI of 40, in the low band.
The 2016 paper by Unwin, Haslam and Livesey describes a leaflet used in Dr Unwin’s practice, and names berries such as blueberries, raspberries and strawberries, with green vegetables and salads, as low in carbohydrate. The paper prints no figure for blueberries or raspberries.
The berries here are whole and fresh. Strawberry jam, strawberry-flavoured yoghurt and dried strawberries are different foods. The one flavoured yogurt in this dataset, raspberry yogurt, comes from the sugar burden chart.
Eight berries is an approximation. Strawberries vary from small to very large, and the figure follows the weight rather than the count.
The numbers
- Glycaemic index
- 40
- Available carbohydrate
- not printed on this source
- Glycaemic load
- 3.8, as printed on the source
- Teaspoons
- 1.4
Glycaemic load printed on the source: 3.8
Teaspoons: 3.8 ÷ 2.73 = 1.4
Source
Read from a published chart: Fruits (sugar infographic). Dr David Unwin. Public Health Collaboration.
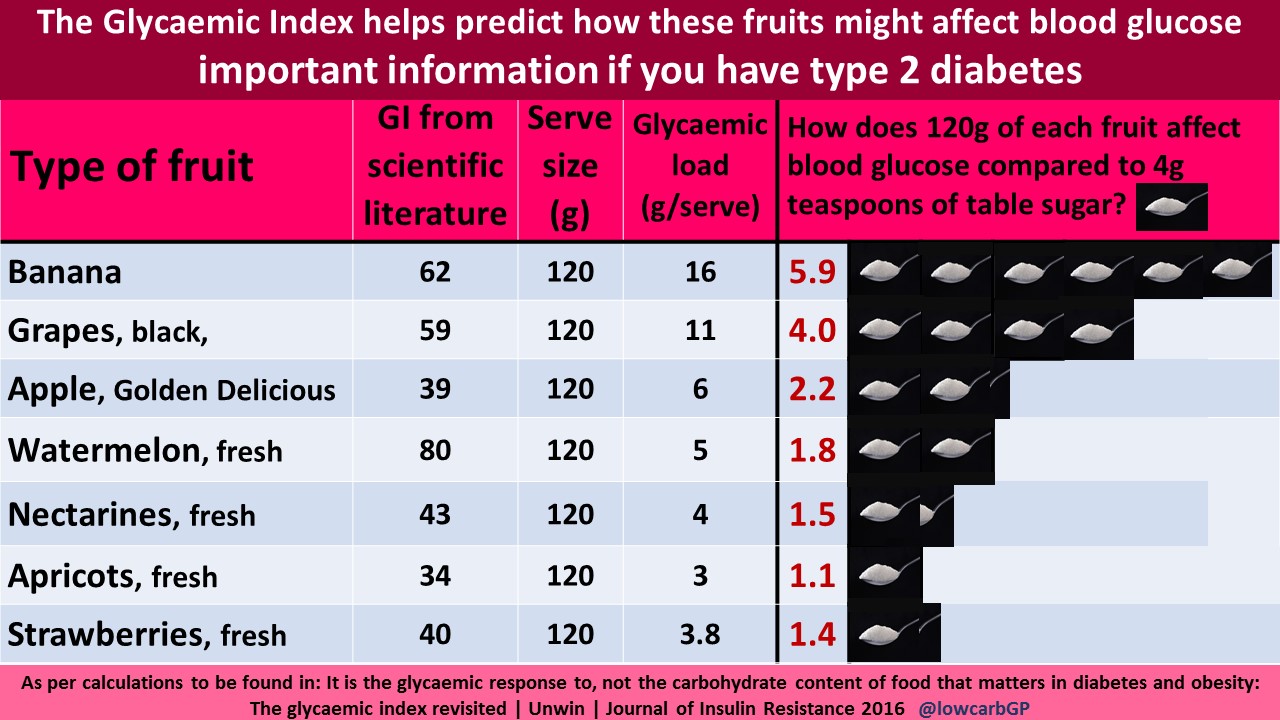
The teaspoon-of-sugar method is the work of Dr David Unwin, and his sugar infographics are published by the Public Health Collaboration at phcuk.org/sugar and used here with PHC's permission. Full provenance for every food is on the sources page.
Side by side
-
Strawberries
about 8 strawberries (120g)
1.4 teaspoons
- Banana
1 medium, peeled (120g)
5.9 teaspoons
- Coco Pops (chocolate puffed rice)
1 bowl, dry (30g)
7.3 teaspoons